We at Crack4sure are committed to giving students who are preparing for the Adobe AD0-E208 Exam the most current and reliable questions . To help people study, we've made some of our Adobe Analytics Business Practitioner Expert exam materials available for free to everyone. You can take the Free AD0-E208 Practice Test as many times as you want. The answers to the practice questions are given, and each answer is explained.
A spike in traffic is observed for a specific day. Knowing that there are no campaigns running, the first hypothesis is that this is bot traffic.
Which Adobe Analytics tool may be used to identify the IP of the user that contributes to this spike in traffic without using a custom variable?
What is the correct functionality when setting up Intelligent Alerts?
An analyst is co-creating a report with their client counterpart in preparation for a running marketing performance dashboard. Marketing is still getting onboarded with the analytics tool and hope to begin leveraging data to enable data-driven decisions.
How would the analyst look to share out the dashboard broadly across the team?
The Solution Design Reference (SDR) document states that the expiration setting for eVarl 1 is "never" and the allocation is Most Recent (Last).
What happens to the persisted value when there is a new value collected for eVar11?
Analyzing the data in the image below, a data analyst verifies that the report of "entries" per page, shows that the "HomePage A" page is responsible for only 3.4% of the total "entries" to the site:
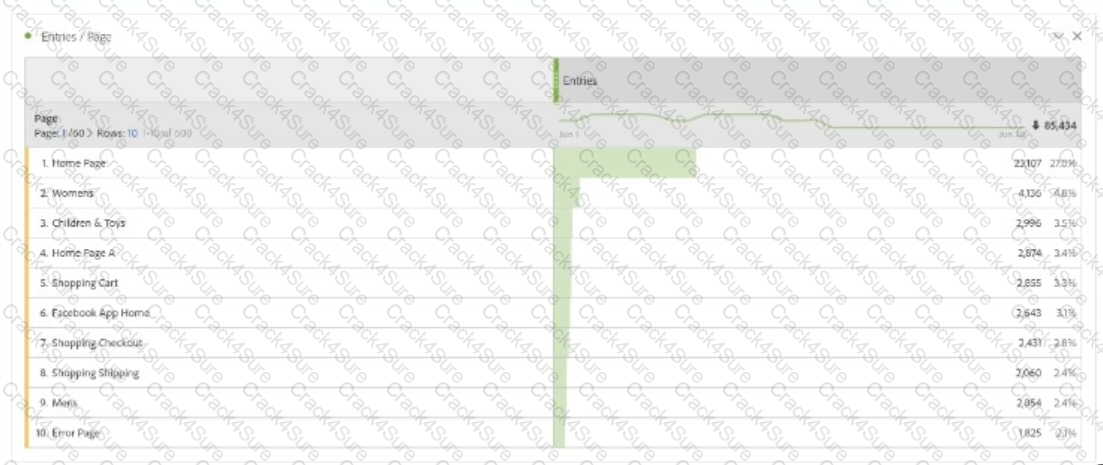
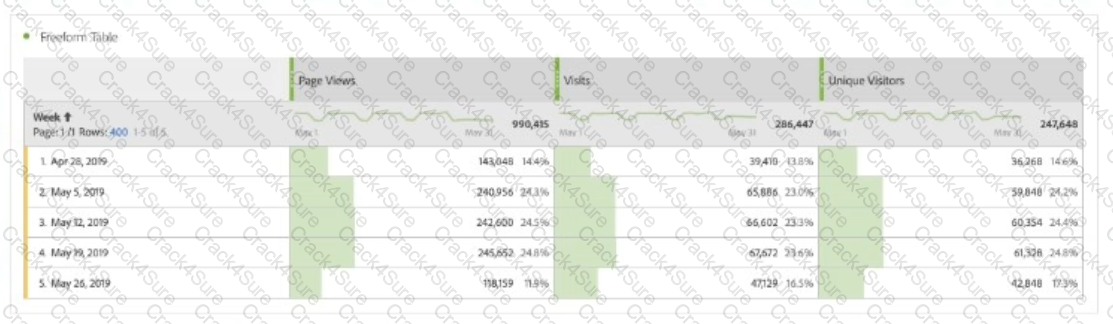
When comparing this information with the Occurrences per Entry Pages report below, it verifies that the "Homepage A" page has 4.5% of the total Occurrences of the Entry Pages:
Based on both the images and knowledge on the standard metrics of Adobe Analytics, which statement is correct?
In Analysis Workspace, what are two ways a Map Visualization can be built? (Choose two.)
A UI/UX manager is concerned that a recent change in the design of a landing page may be confusing to visitors.
Which two variables would be used to evaluate the impact of the design change on site traffic to that landing page? (Choose two.)
Exhibit.
A business stakeholder receives a Workspace report that indicates that data is incorrect. The sums of the items in the rows do not match the total metric values of the columns in the unique visitors and visits report.
Which statement about the report is true?
A UI/UX manager asks an analyst to create an Analysis workspace visualization that shows all visits to English (/En) pages. The workspace is accessible by multiple stakeholders, most of whom have edit access.
Which visualization approach would be used?
An analyst is given a list of specific events a user must take to complete a purchase. What would be used to see the conversion rate between steps?
3 Months Free Update
3 Months Free Update
3 Months Free Update

TESTED 26 Jun 2026