Weekend Special Sale - 75% Discount Offer - Ends in 0d 00h 00m 00s - Coupon code: 75special

Practice Free 500-420 Cisco AppDynamics Associate Performance Analyst (CAAPA) Exam Questions Answers With Explanation

We at Crack4sure are committed to giving students who are preparing for the Cisco 500-420 Exam the most current and reliable questions . To help people study, we've made some of our Cisco AppDynamics Associate Performance Analyst (CAAPA) exam materials available for free to everyone. You can take the Free 500-420 Practice Test as many times as you want. The answers to the practice questions are given, and each answer is explained.

Question # 6

What are two types of Data Collectors in AppDynamics APM? (Choose two.)

A.

SQL data collectors

B.

HTTP data collectors

C.

Remote Service invocation data collectors

D.

Method invocation data collectors

Question # 7

Under the Troubleshooting menu, which option allows viewing of transaction snapshots?
A.

Health Rule Violations

B.

Slow Response Times

C.

Slow and Error Transactions

D.

War Rooms

Question # 8

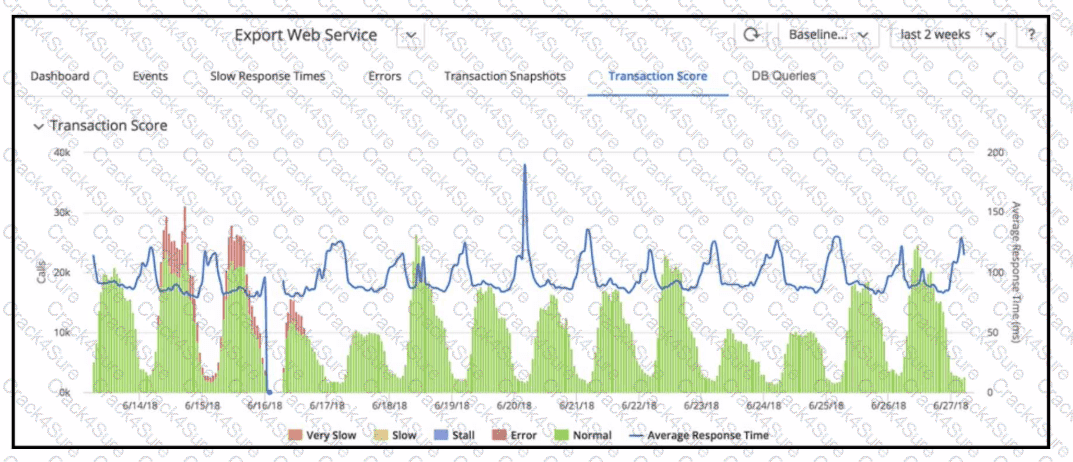
500-420 question answer

Refer to the exhibit. When looking at the Transaction Score for a specific transaction, how are errors in the transaction identified?

A.

Set the time range and drill down into the snapshots in the Error tab.

B.

Set the time range and examine the Slow Response Times tab.

C.

Set the time range and examine the dashboard for errors.

D.

Set the time range and drill down into the snapshots in the Events tab.

Question # 9

Which three programming languages are supported by the AppDynamics Application Performance Monitoring solution? (Choose three.)

A.

Go Language

B.

Perl

C.

C/C++

D.

React

E.

iOS Family

F.

C#

Question # 10

Within the Application Dashboard, which two methods could a Performance Analyst use to quickly demonstrate that a slow backend is contributing to an application slowdown? (Choose two.)

A.

Select Top Business Transactions, choose By Response Time, and compare the backend’s response time for the available timeframes.

B.

Select Application Flow – Grid View, locate and select the slow backend, and compare response time for the available timeframes.

C.

Select Transaction Snapshots, review Slow and Error Transactions, and compare the backend’s response time for the available timeframes.

D.

Select Application Flow Map, locate and select the backend, and compare response time for the available timeframes.

Question # 11

Developers and operations personnel complain that the Controller tracks many irrelevant Java classes and methods. How does a Performance Analyst exclude this unhelpful information?

A.

Configuration > Instrumentation > Call Graph Settings and exclude irrelevant packages

B.

Edit the controller-info.xml file to exclude irrelevant methods

C.

Configuration > Baselines and create a new dynamic baseline

D.

Edit the mbeans-server.xml file to delete the irrelevant methods

Question # 12

Business users of an e-commerce site want to see the running aggregate checkout value stored in the Java class Checkout. How would a Performance Analyst capture this data?

A.

Create a dashboard widget to total Business Transactions

B.

Create a method invocation data collector

C.

Create an HTTP data collector

D.

Export the data hourly with a REST call

Question # 13

Which built-in scheduled report Includes load, response time, and error graphs?

A.

Dashboard Report

B.

All Application Summary

C.

Application Health Report

D.

User Experience: Browser Apps

Question # 14

A Performance Analyst received an alert that the Average Response Time is increasing after a new marketing offer was released. Which metric would quickly help the Performance Analyst determine that users may not be critically impacted?

A.

Errors per Minute increase

B.

Calls per Minute decrease

C.

Errors per Minute decrease

D.

Calls per Minute increase

Question # 15

Within the configuration setting for Slow Transactions, under the " Configure Diagnostic Session Duration and Collection Rate " option, what is the default value pair for the setting " Collect up to ____snapshots per minute for _____ minutes " ?

A.

2,2

B.

5,5

C.

10, 10

D.

4,4

Question # 16

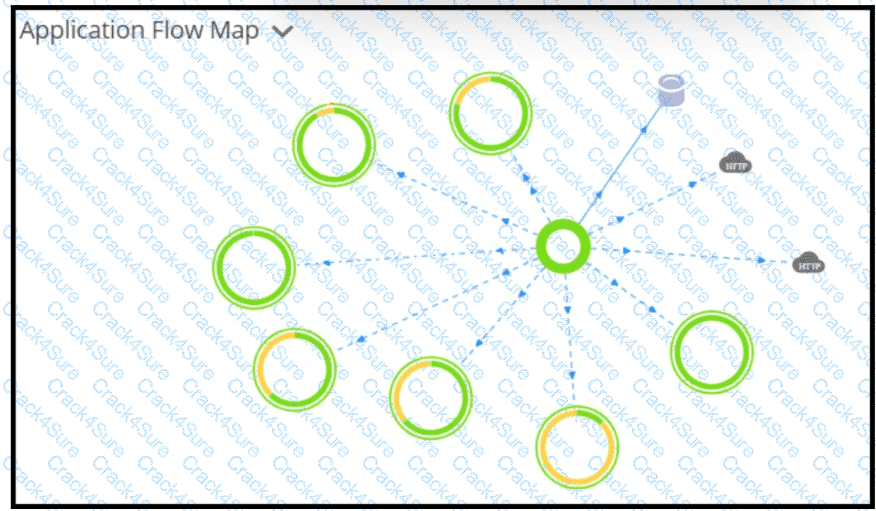
Refer to the exhibit.

500-420 question answer

The application flow map shows several downstream applications in yellow, while the flow lines are blue and activity within the current application appears normal. Because the tier depends on these downstream applications, how could a Performance Analyst quickly evaluate the map against previous performance?

A.

Use the function Compare Against Baseline

B.

Use Correlation Analysis

C.

Open and review the Health Rule Violations

D.

View the Metric Browser Baselines

Question # 17

When a manual diagnostic session is triggered, what snapshots are captured?

A.

Snapshots for all nodes that contributed to slow, very slow, or error business transactions

B.

Snapshots for all nodes through which a business transaction passes

C.

Snapshots for all slow, very slow, or error business transactions regardless of node

D.

Snapshots on the triggering nodes at the start of the business transaction

Question # 18

What are two default Business Transaction limits at the Application and Node levels? (Choose two.)

A.

Application 100

B.

Application 200

C.

Application 300

D.

Node 50

E.

Node 75

F.

Node 200

Question # 19

What are two options tor sharing snapshot details from the snapshot window? (Choose two.)

A.

Custom Report

B.

Custom Dashboard

C.

Download PDF

D.

Copy to Clipboard

E.

Export

Question # 20

Which tool should be used to analyze all the External Call details, including database and remote service calls, for a specific Business Transaction?

A.

Business Transaction List

B.

Application Dashboard

C.

Transaction Snapshot

D.

Metric Browser

Question # 21

Which dashboard can be used to identify potential Business Transactions contributing to an increase in Error Counts?

A.

Transaction Score – Snapshots

B.

Top Business Transactions – by Errors

C.

Transaction Snapshots – All Snapshots

D.

Application Flow – Grid View

Question # 22

Which option should a Performance Analyst use in an environment where virtual machines are routinely created and destroyed?

A.

-Dappdynamics.agent.auto.node.prefix and -Dappdynamics.cron.vm

B.

-Dappdynamics.http.proxyHost and -Dappdynamics.http.proxyUser

C.

-Dappdynamics.agent.node.metainfo and -Dappdynamics.agent.nodeName

D.

-Dappdynamics.agent.reuse.nodeName and -Dappdynamics.agent.reuse.nodeName.prefix

Question # 23

An AppDynamics deployment has Business Transaction Lock Down turned on. The company has just added an important service to its application and wants to track this service as a unique Business Transaction. What action is needed to achieve this?

A.

Use the Business Transaction Dashboard for the tier-specific All Other Traffic to register the Business Transaction

B.

Modify the Automatic Transaction Discovery rule to include the Web Service Name and Operation Name

C.

Use live preview to identify the Business Transaction and Register it from there

D.

Create a Custom Transaction Match Rule based on the Web Service Name and Operation Name

Question # 24

With what frequency are widgets updated during a war room scenario?

A.

Near real-time

B.

Every 5 minutes

C.

Every 10 minutes

D.

Every 60 minutes

Question # 25

Which three reports can be scheduled for periodic generation and delivery to email recipients? (Choose three.)

A.

Ad Hoc Data

B.

Error Trends

C.

Application Health

D.

Tier List

E.

Controller Audit

F.

Custom Dashboard

Question # 26

Which permission allows snapshot archiving?

A.

" Can view data from all applications "

B.

" Configure Business Transactions "

C.

" Agent Advanced Operation "

D.

" Application level - Can create applications "

Question # 27

Which values can be used to identify a split exit point?

A.

Variable application values

B.

Tetration application values

C.

Dynamic application values

D.

Static application values

Question # 28

What must a Performance Analyst first configure in order to monitor end-to-end latency performance metrics in AppDynamics?

A.

additional demarcator methods

B.

define the end-to-end latency transaction

C.

slow end-point identity markers

D.

endpoints for asynchronous transactions

Question # 29

When a team of developers refactored their code, resulting in class-name changes, Business iQ users reported that metrics had disappeared. Where should a Performance Analyst look to troubleshoot this problem?

A.

Applications > Troubleshoot > Errors

B.

Configuration > Slow Transaction Thresholds

C.

Configuration > Instrumentation > Data Collectors

D.

Databases > Configuration > Collectors

Question # 30

Which option is a prerequisite for installing the AppDynamics Database Agent?

A.

The data architect has reviewed the most frequently used primary keys.

B.

The TCP queue’s tcp_max_syn_backlog is sized correctly.

C.

The database host is reachable from the agent host.

D.

The database administrator dropped system table keys.

Question # 31

What is the purpose of a transaction snapshot?

A.

To analyze issues with a specific business transaction

B.

To analyze issues only with a transaction flagged as stalled

C.

To analyze issues with a specific instances of a transaction

D.

To analyze issues only with a transaction flagged as slow

Question # 32

What AppDynamics Alert Action does a Performance Analyst need to select to post an AppDynamics event to a third-party collaboration tool?

A.

Make an HTTP Request

B.

Create or Update a JIRA Ticket

C.

Take a thread dump

D.

Run a script or executable on problematic nodes

Question # 33

Which three Key Performance Indicators (KPIs) are automatically collected when you create an Information Point without adding custom data? (Choose three.)

A.

Minimum Response Time

B.

Response Time

C.

CPU Time

D.

Errors per Minute

E.

Calls per Minute

F.

Maximum Response Time

Question # 34

What is the Node limit of the maximum Service Endpoints per node?

A.

50

B.

100

C.

250

D.

1000

Question # 35

Which format is used to archive dashboard metadata?

A.

Dashboard metadata can be archived as a PDF.

B.

Dashboard metadata can be archived as a CSV.

C.

Dashboard metadata can be archived as an XLSX.

D.

Dashboard metadata can be archived as JSON.

Question # 36

A Performance Analyst needs to define a special database Key Performance Indicator (KPI). Which menu options should be used?

A.

Databases > Metric Browser > Add

B.

Applications > Configuration > Instrumentation

C.

Databases > Configuration > Custom Metrics

D.

Applications > Configuration > Slow Transaction Thresholds

Question # 37

Which two types of data are collected by Information Points? (Choose two.)

A.

Troubleshooting Metric Data

B.

Business Metric Data

C.

Code Metric Data

D.

Analytics Metric Data

500-420 PDF

$35

$139.99

3 Months Free Update

  • Printable Format
  • Value of Money
  • 100% Pass Assurance
  • Verified Answers
  • Researched by Industry Experts
  • Based on Real Exams Scenarios
  • 100% Real Questions

500-420 PDF + Testing Engine

$47.5

$189.99

3 Months Free Update

  • Exam Name: Cisco AppDynamics Associate Performance Analyst (CAAPA)
  • Last Update: Aug 24, 2026
  • Questions and Answers: 124
  • Free Real Questions Demo
  • Recommended by Industry Experts
  • Best Economical Package
  • Immediate Access

500-420 Engine

$40

$159.99

3 Months Free Update

  • Best Testing Engine
  • One Click installation
  • Recommended by Teachers
  • Easy to use
  • 3 Modes of Learning
  • State of Art Technology
  • 100% Real Questions included