We at Crack4sure are committed to giving students who are preparing for the Microsoft PL-300 Exam the most current and reliable questions . To help people study, we've made some of our Microsoft Power BI Data Analyst exam materials available for free to everyone. You can take the Free PL-300 Practice Test as many times as you want. The answers to the practice questions are given, and each answer is explained.
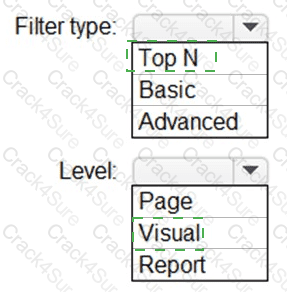
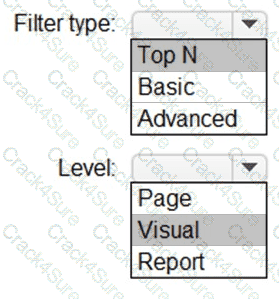
You need to create the Top Customers report.
Which type of filter should you use, and at which level should you apply the filter? To answer, select the appropriate options in the answer area.
NOTE: Each correct selection is worth one point.
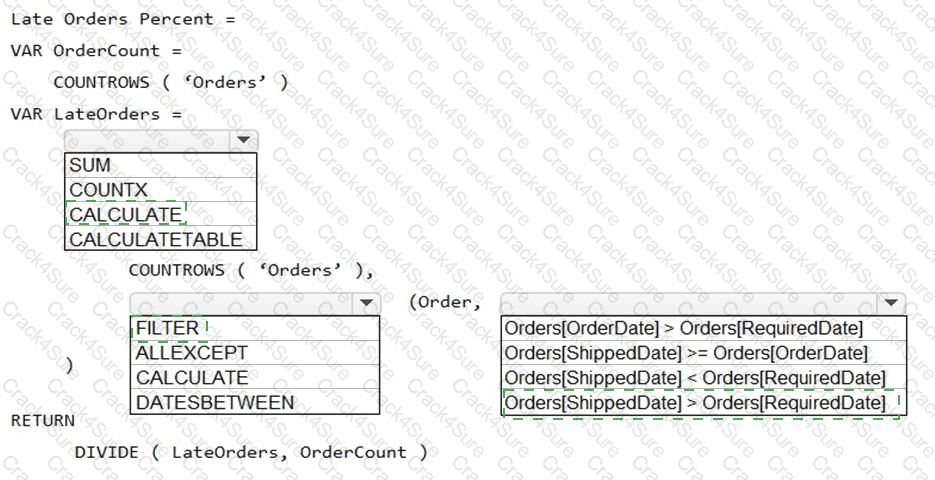
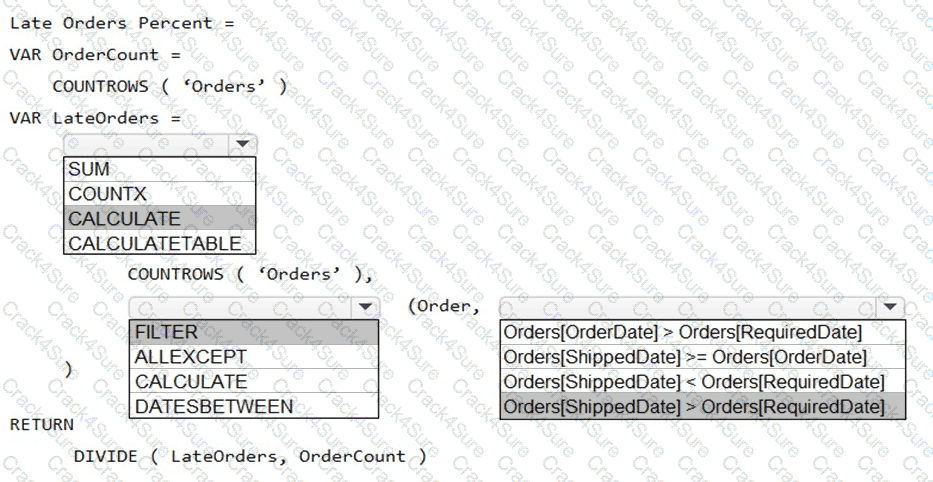
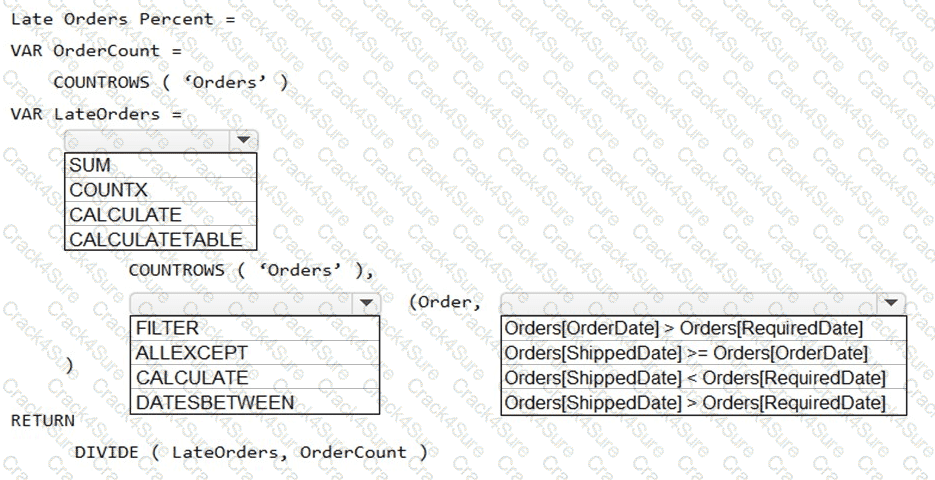
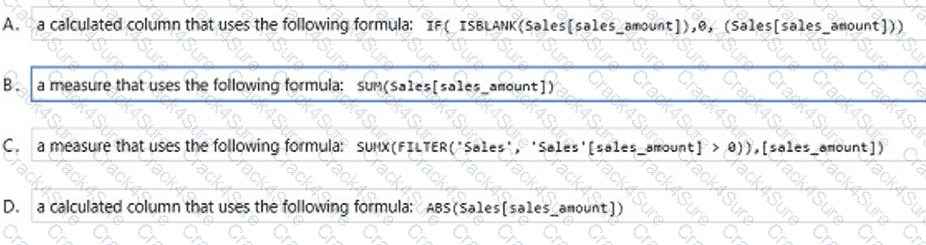
You need to create a measure that will return the percentage of late orders.
How should you complete the DAX expression? To answer, select the appropriate options in the answer area.
NOTE: Each correct selection is worth one point.
You publish the semantic model to powerbi.com.
For each of the following statements, select Yes if the statement is true. Otherwise, select No.
NOTE: Each correct selection is worth one point.

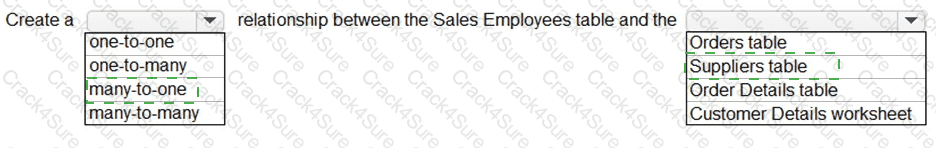
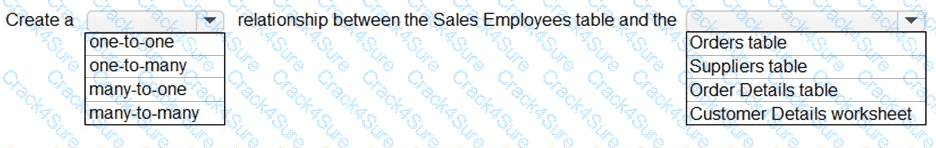
You need to create relationships to meet the reporting requirements of the customer service department.
What should you create?
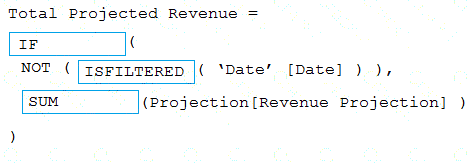
You need to create a DAX measure in the data model that only allows users to see projections at the appropriate levels of granularity.
How should you complete the measure? To answer, drag the appropriate values to the correct targets. Each value may be used once, more than once, or not at all. You may need to drag the split bar between panes or scroll to view content.
NOTE: Each correct selection is worth one point.

You need to recommend a strategy to consistently define the business unit, department, and product category data and make the data usable across reports.
What should you recommend?
You need to design the data model to meet the report requirements.
What should you do in Power BI Desktop?
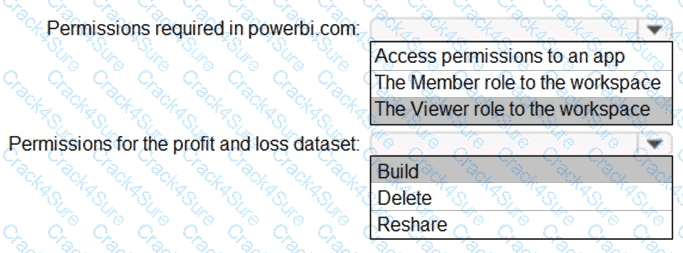
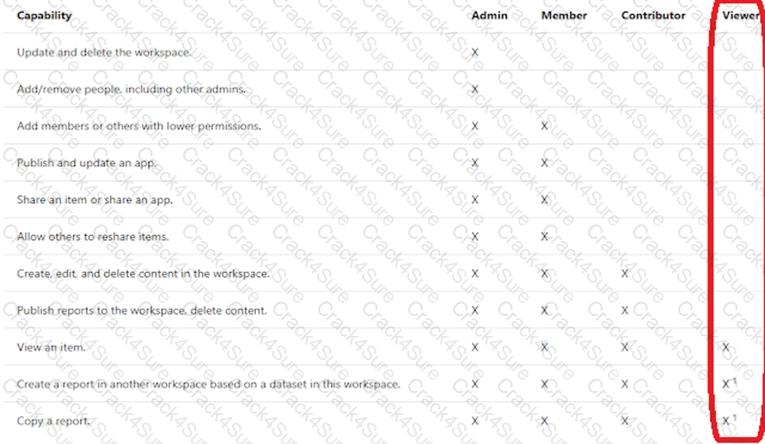
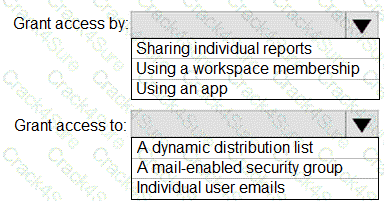
You need to provide a solution to provide the sales managers with the required access.
What should you include in the solution?
You need to create the On-Time Shipping report. The report must include a visualization that shows the percentage of late orders.
Which type of visualization should you create?
You merge data from Sales.Region, Region_Manager, Sales_Manager, and Manager into a single table named Region. What should you do next to meet the reporting requirements of the executives?
You need to create a relationship in the dataset for RLS.
What should you do? To answer, select the appropriate options in the answer area.
NOTE: Each correct selection is worth one point.
You need to address the data concerns before creating the data model. What should you do in Power Query Editor?
What should you create to meet the reporting requirements of the sales department?
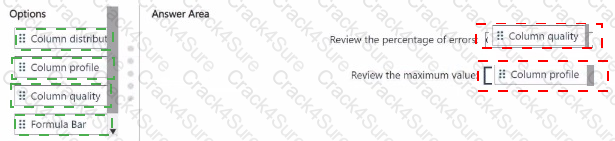
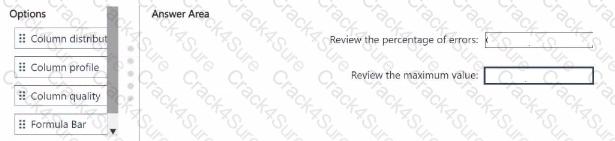
You a-e using Power Bl Desktop 10 profile data in Power Query Editor.
You need to review the percentage of errors and the maximum value of each column.
Which options should you use in Power Query Editor? To answer, drag the appropriate options to the correct requirements. Each option may be used once, more than once, or not at all. You may need to drag the split bar between panes or scroll to view content.
NOTE: Each correct selection is worth one point.
You need to create the required relationship for the executive's visual. What should you do before you can create the relationship?
You need to create a solution to meet the notification requirements of the warehouse shipping department.
What should you do? To answer, select the appropriate options in the answer area.
NOTE: Each correct select is worth one point:

You need to configure access for the sales department users. The solution must me meet the security requirements. What should you do?
You use Power Query to import two tables named Order Header and Order Details from an Azure SQL database. The Order Header table relates to the Order Details table by using a column named Order ID in each table.
You need to combine the tables into a single query that contains the unique columns of each table.
What should you select in Power Query Editor?
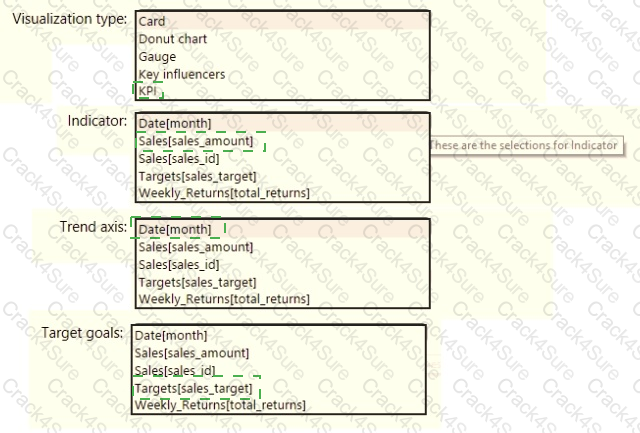
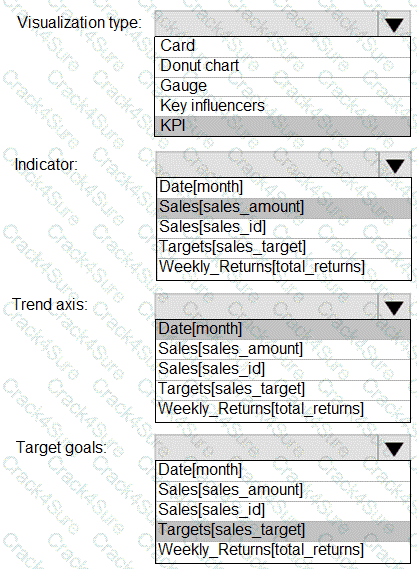
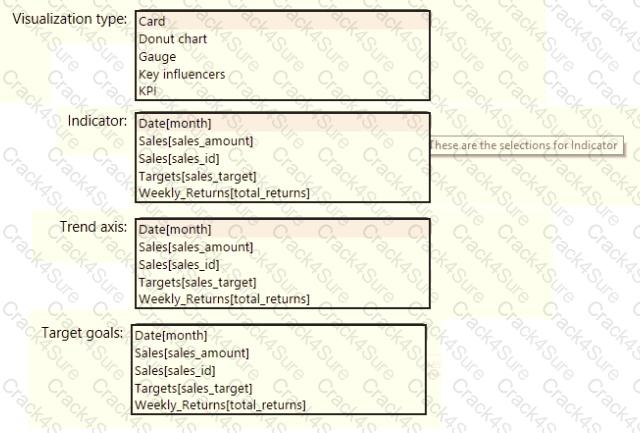
You need to create a visualization to meet the reporting requirements of the sales managers.
How should you create the visualization? To answer, select the appropriate options in the answer area.
NOTE: Each correct selection is worth one point.
You publish the dataset to powerbi.com.
For each of the following statements, select Yes if the statement is true. Otherwise, select No.
NOTE: Each correct selection is worth one point.

Which two types of visualizations can be used in the balance sheet reports to meet the reporting goals? Each correct answer presents part of the solution.
NOTE: Each correct selection is worth one point.
What is the minimum number of datasets and storage modes required to support the reports?
You need to create the dataset. Which dataset mode should you use?
You need to grant access to the business unit analysts.
What should you configure? To answer, select the appropriate options in the answer area.
NOTE: Each correct selection is worth one point.

You need to create the semantic model.
Which storage mode should you use for the tables in the semantic model?
You need to minimize the size of the semantic model. The solution must meet the report requirements.
What should you do?
What should you do to address the existing environment data concerns?
You need to create the relationship between the product list and the revenue results. The solution must minimize the time it takes to render visuals.
What should you set as the relationship cardinality?
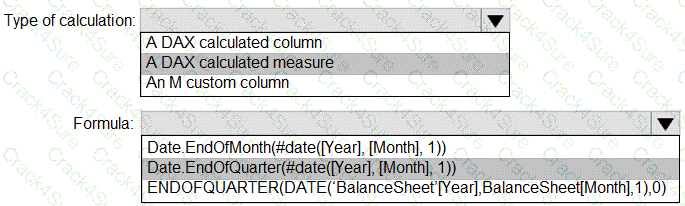
You need to calculate the last day of the month in the balance sheet data to ensure that you can relate the balance sheet data to the Date table. Which type of calculation and which formula should you use? To answer, select the appropriate options in the answer area. NOTE: Each correct selection is worth one point.

You have a Power B1 report named ReportA.
You have a Power B1 tenant that allows users to export data.
You need to ensure that consumers of ReportA cannot effort any data from visuals.
Which two actions should you perform? Each correct answer presents a complete solution.
NOTE Each correct selection is worth one point.
You need to ensure that the data is updated to meet the report requirements. The solution must minimize configuration effort.
What should you do?
How should you distribute the reports to the board? To answer, select the appropriate options in the answer area.
NOTE: Each correct selection is worth one point.
You need to design the data model to meet the report requirements. What should you do m Power Bl Desktop?
Note: This question is part of a series of questions that present the same scenario. Each question in the series contains a unique solution that might meet the stated goals. Some question sets might have more than one correct solution, while others might not have a correct solution.
After you answer a question in this section, you will NOT be able to return to it. As a result, these questions will not appear in the review screen.
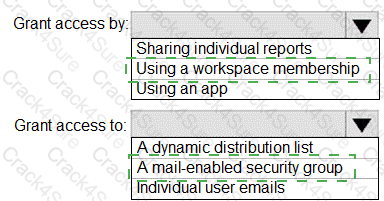
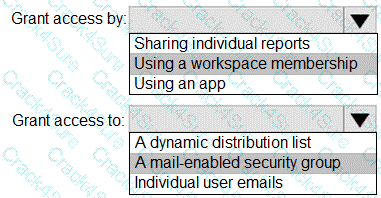
You have five reports and two dashboards in a workspace.
You need to grant all organizational users read access to one dashboard and three reports
Solution: In Microsoft Azure Active Directory (Azure AD), part of Microsoft Entra. you create a group that contains all the users. You share each selected report and the one dashboard to the group.
Does this meet the goal?
What should you create to meet the reporting requirements of the sales department?
You have a report in Power BI Desktop.
You add a key influencers visual as shown in the exhibit. (Click the Exhibit tab.)
Use the drop-down menus to select the answer choice that completes each statement based on the information presented in the graphic.
NOTE: Each correct selection is worth one point.
You have a Power BI report named Report' and a dashboard named Dashboard'. Report1 contains a line chart named Sales by month.
You pin the Sales by month visual to Dashboard1.
In Report1, you change the Sales by month visual to a bar chart.
You need to ensure that the bar chart displays on Dashboard',
What should you do?
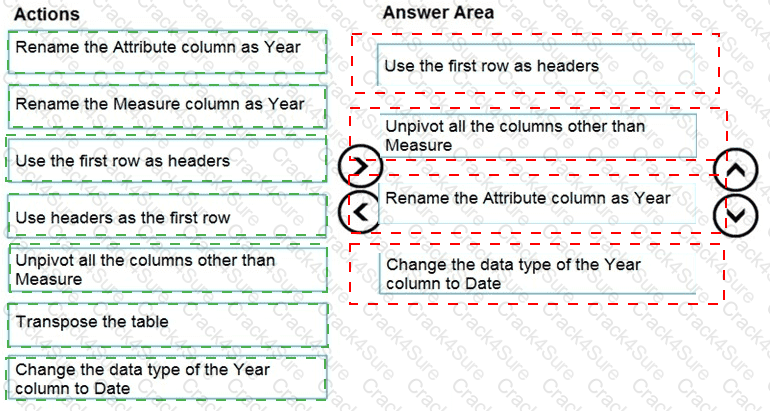
You are preparing a financial report in Power BI.
You connect to the data stored in a Microsoft Excel spreadsheet by using Power Query Editor as shown in the following exhibit.
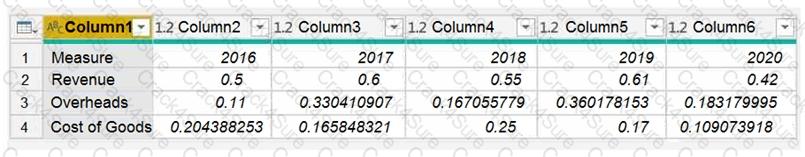
You need to prepare the data to support the following:
Visualizations that include all measures in the data over time
Year-over-year calculations for all the measures
Which four actions should you perform in sequence? To answer, move the appropriate actions from the list of actions to the answer area and arrange them in the correct order.
You have a semantic model that connects to a streaming data source. The data source is updated frequently. You need to create a Power B1 report that meets the following requirements:
• Supports real-time analytics
• Minimizes performance impact on the data source
• Displays the most recent data without performing a data refresh
Which connectivity mode should you use for the dataset?
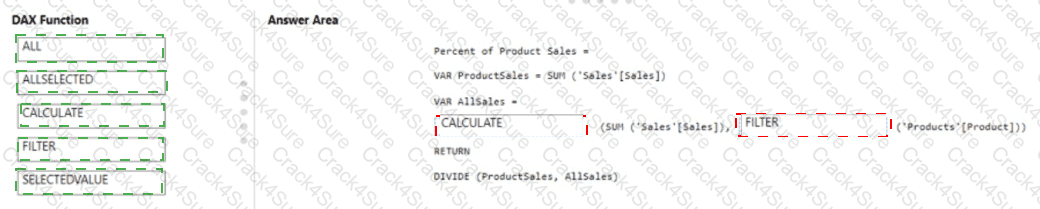
You have a Power B1 data model that contains two tables named Products and Sales.
A one-to-many relationship exists between the tables.
You have a report that contains a report-level filter for Products.
You need to create a measure that will return the percent of total sales for each product. The measure must respect the report-level filter when calculating the total.
How should you complete the DAX measure? To answer drag the appropriate DAX functions to the correct targets- Each function may be used once, more than once, or not at all the spirt bar between panes or scroll to view content
NOTE: Each correct selection is worth one point
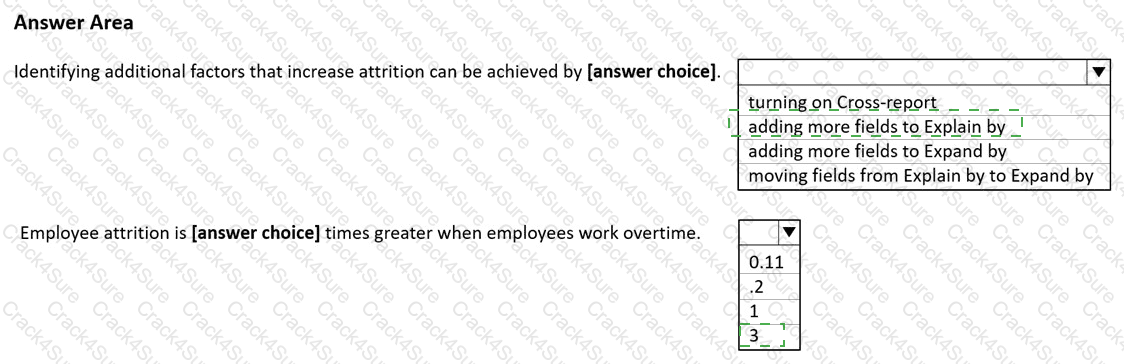
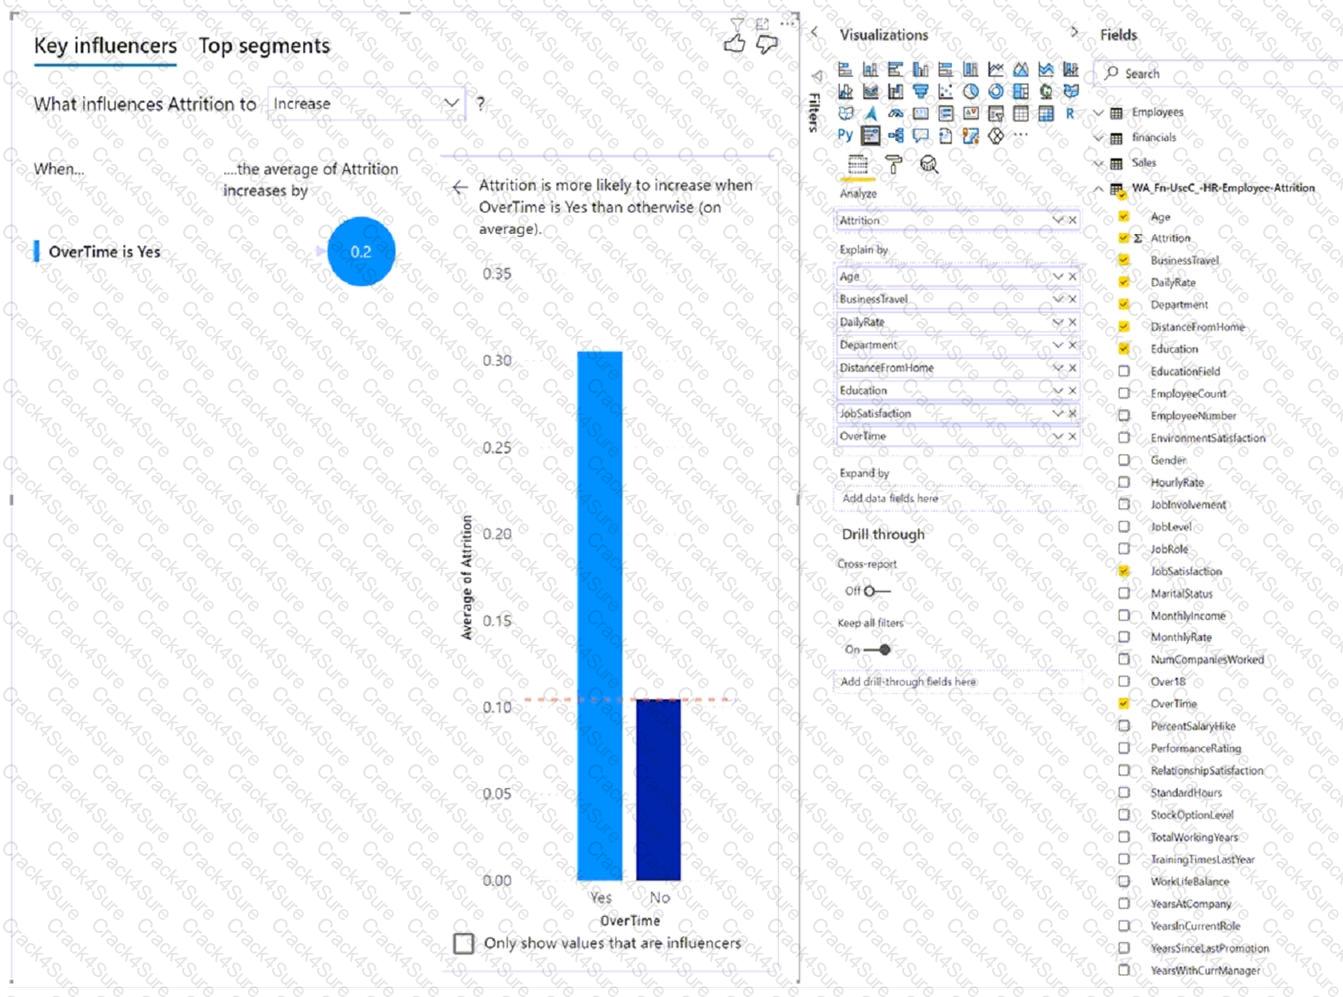
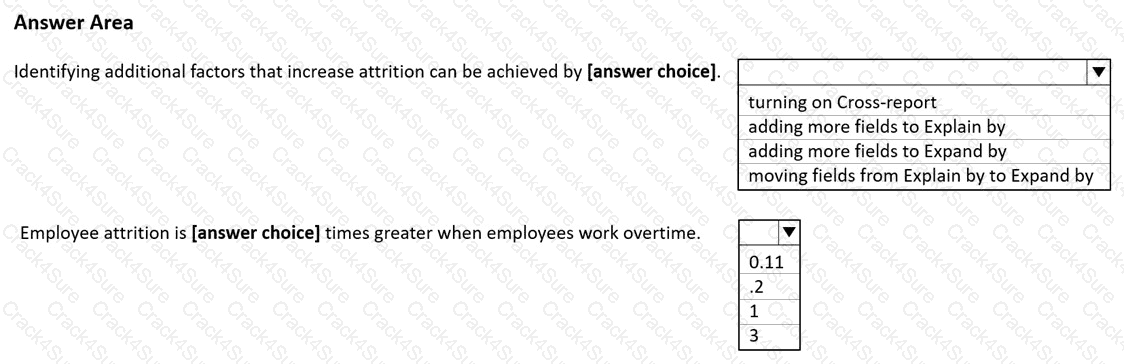
You are using the key influencers visual to identify which factors affect the quantity of items sold in an order.
You add the following fields to the Explain By field:
* Customer Country
* Product Category
* Supplier Country
* Sales Employee
* Supplier Name
* Product Name
* Customer City
The key influencers visual returns the results shown in the following exhibit.
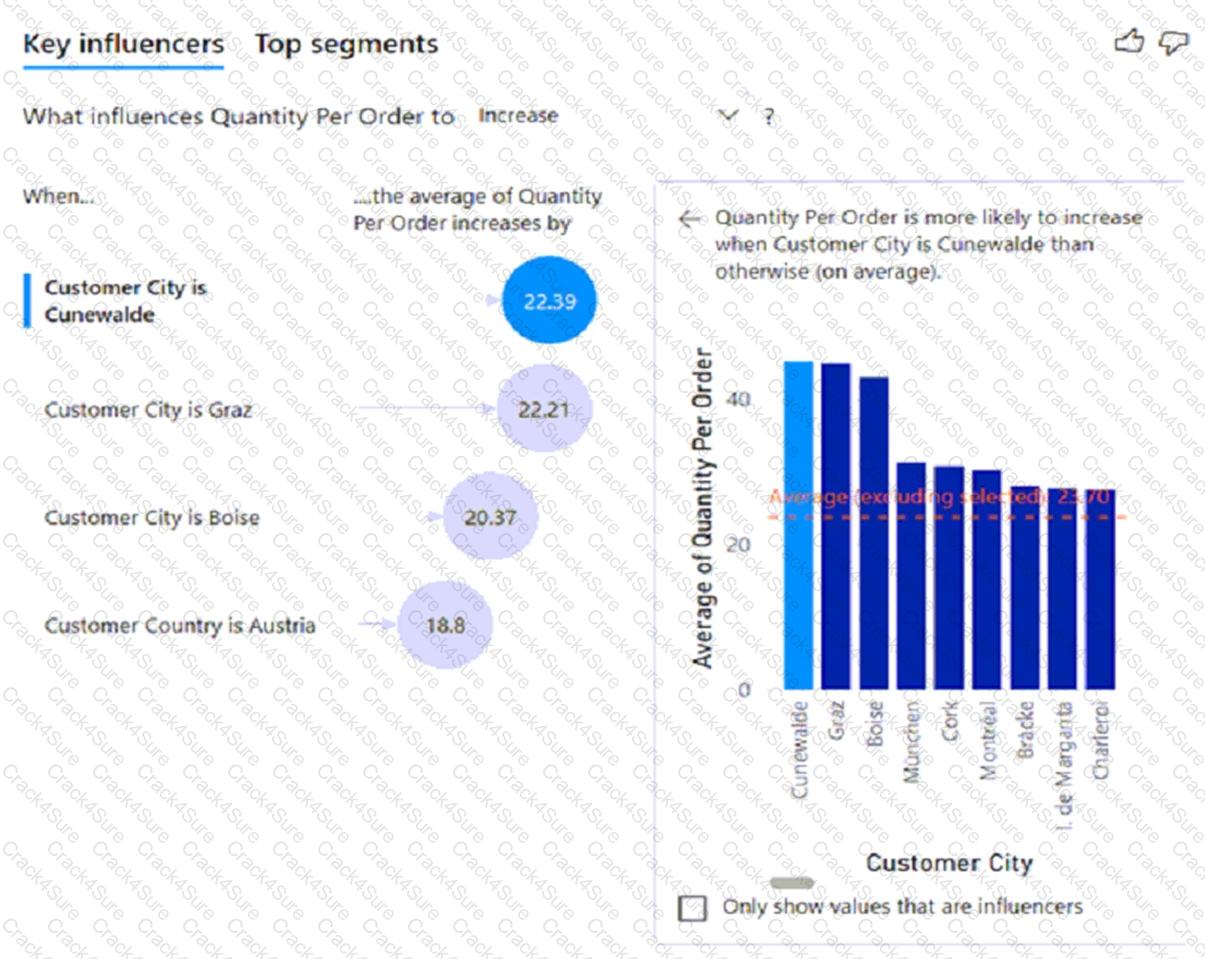
What can you identify from the visual?
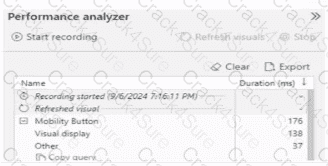
You have the Performance analyzer results shown in the following exhibit.
You have a Power Bl report that contains the visual shown in the following exhibit.
You need to make the visual more accessible to users who have color vision deficiency.
What should you do?
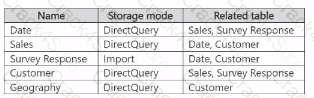
You have a Power B1 semantic model that contains the following tables.

You have data in a Microsoft Excel worksheet as shown in the following table.
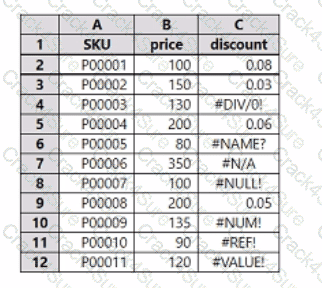
You need to use Power Query to clean and transform the dataset. The solution must meet the following requirements:
• If the discount column returns an error, a discount of 0.05 must be used.
• All the rows of data must be maintained.
• Administrative effort must be minimized.
What should you do in Power Query Editor?
You plan to use Power B1 to create sales invoices for customers. The solution must meet the following requirements:
• Sales invoices must be exported in a PDF format
• The PDF exports must show all columns and rows clearly.
What should you create?
You have a Fabric workspace named Workspace1 that contains two Power Bl reports named Report1 and Report2.
You create a workspace app that contains both reports.
You need to ensure that the app meets the following requirements:
• Report1 must be visible to all the users in your organization.
• Report2 must be visible to only a security group named Group1.
What should you do next?
Note: This question is part of a series of questions that present the same scenario. Each question in the series contains a unique solution that might meet the stated goals. Some question sets might have more than one correct solution, while others might not have a correct solution.
After you answer a question in this section, you will NOT be able to return to it. As a result, these questions will not appear in the review screen.
You create a parameter named DataSourceExcel that holds the file name and location of a Microsoft Excel data source.
You need to update the query to reference the parameter instead of multiple hard-coded copies of the location within each query definition.
Solution: You modify the source step of the queries to use DataSourceExcel as the file path.
Does this meet the goal?
You import two Microsoft Excel tables named Customer and Address into Power Query Customer contains the following columns:
• Customer ID
• Customer Name
• Phone
• Email Address
• Address ID
Address contains the following columns:
• Address ID
• Address Line 1
• Address Line 2
• City
• State/Region
• Country
• Postal Code
Each Customer ID represents a unique customer m the Customer table. Each Address ID represents a unique address m the Address table. You need to create a query that has one row per customer. Each row must contain City. State/Region, and Country for each customer. What should you do?
You have a Power Bl report that contains the visual shown in the following exhibit.
You have a Power Bl semantic model that contains the data sources shown in the following table.
You need to configure the privacy levels of the data sources.
What should you configure (01 each data source? To answer, select (he appropriate options in the answer area.
NOTE: Each correct answer is worth one point.

You have a semantic model named Model1 that contains the following tables
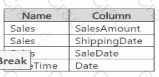
There is an active relationship between SaleDate and Date.
There is an inactive relationship between ShippingDate and Date-
You need to create a new measure that will display the total amount of sales and support slicing by ShippingDate.

You attempt to open a PBiX file in Microsoft Power Bl Desktop and receive the following error message in Power Query Editor.
DataSource. Error: Could of not find file D:\Data.txt.
How should you resolve the issue?
Note: This question is a part of a series of questions that present the same scenario. For your convenience, the scenario is repeated in each question. Each question presents a different goal and answer choices, but the text of the scenario is exactly the same in each question in this series.
Start of repeated scenario
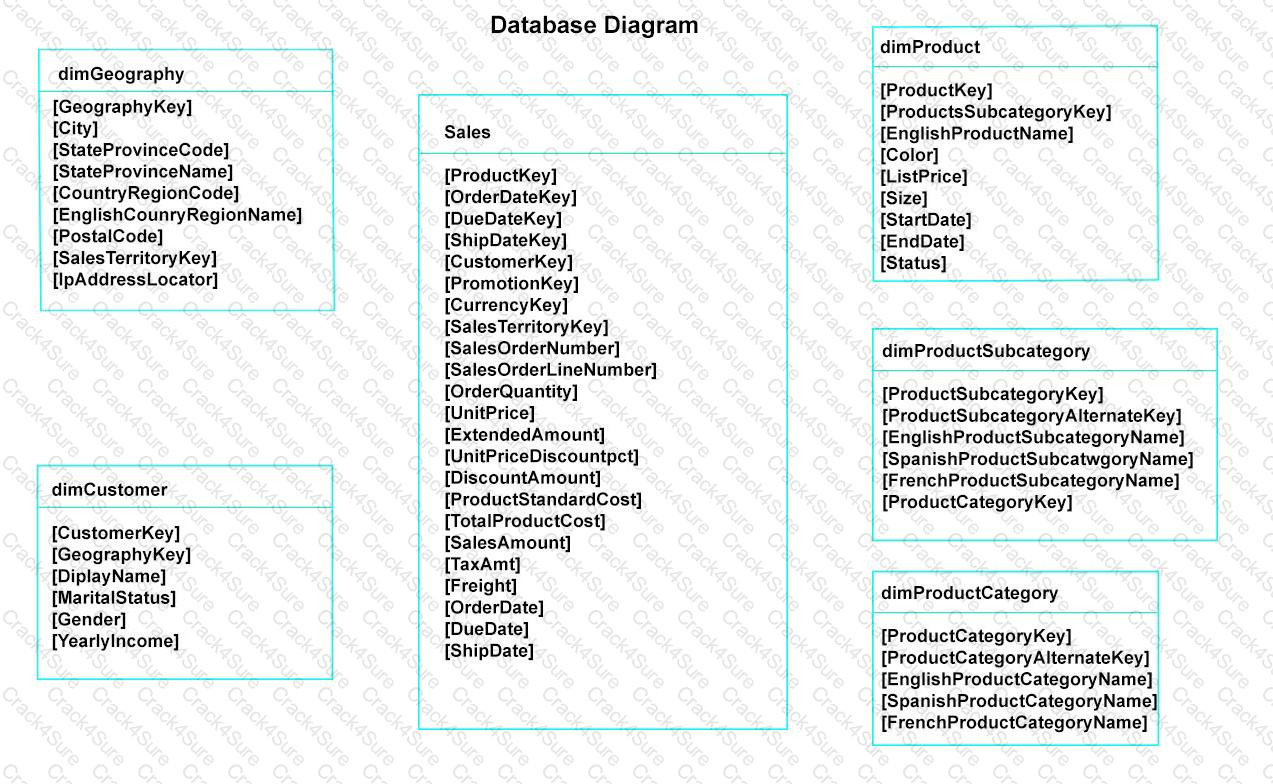
You have a Microsoft SQL Server database that has the tables shown in the Database Diagram exhibit. (Click the Exhibit.)
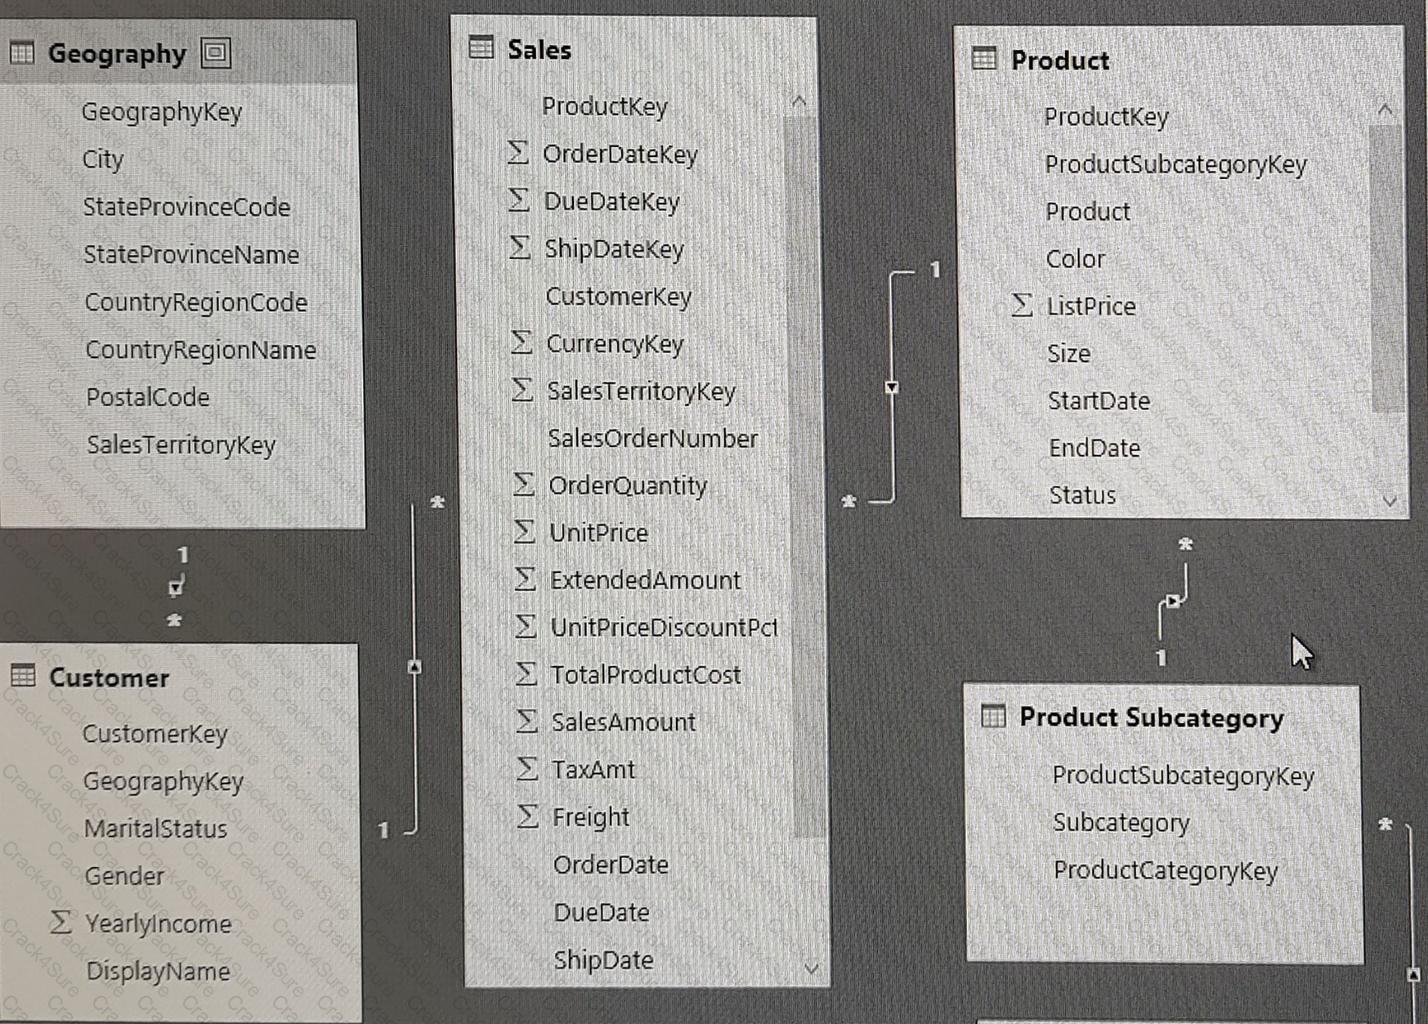
You plan to develop a Power BI model as shown in the Power BI Model exhibit. (Click the Exhibit).
You plan to use Power BI to import data from 2013 to 2015.
Product Subcategory [Subcategory] contains NULL values.
End of repeated scenario.
You implement the Power BI model.
You need to add a new column to the Product Subcategory table that uses the following formula.
=if [Subcategory] =null then “NA” else [Subcategory]
Which command should you use in Query Editor?
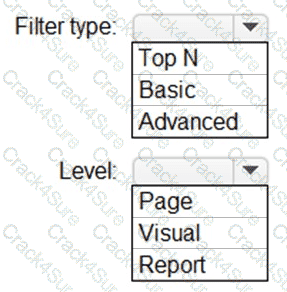
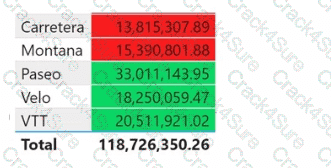
You have the dataset shown in the following exhibit.
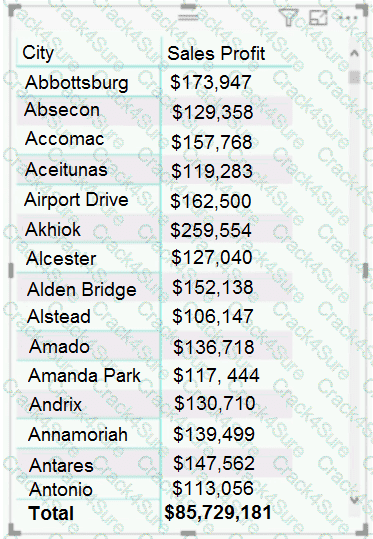
You need to ensure that the visual shows only the 10 cities that have the highest sales profit.
What should you do?
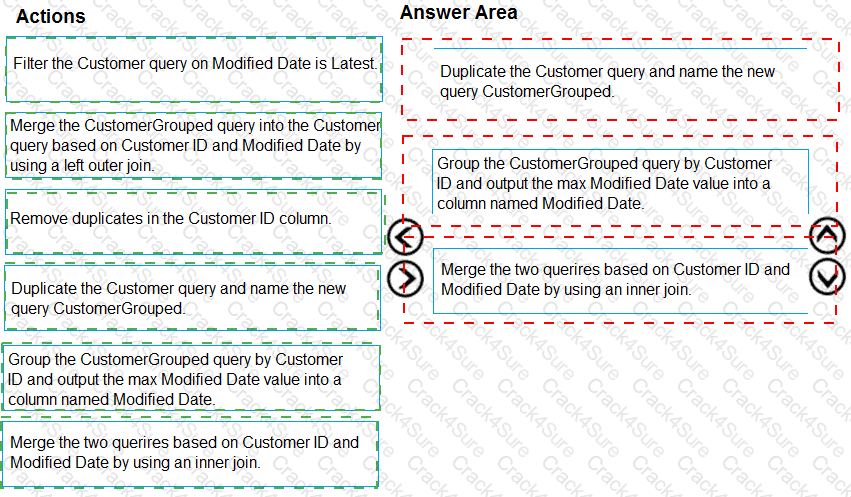
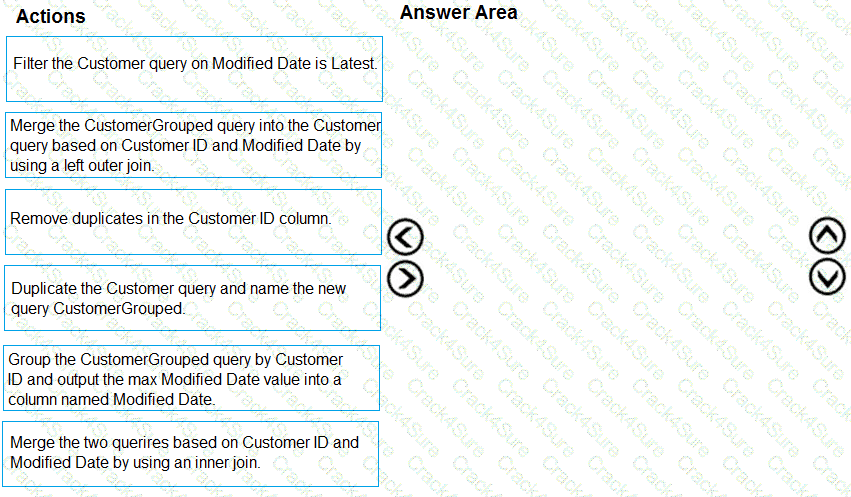
You have a query named Customer that imports CSV files from a data lake. The query contains 500 rows as shown in the exhibit. (Click the Exhibit tab.)
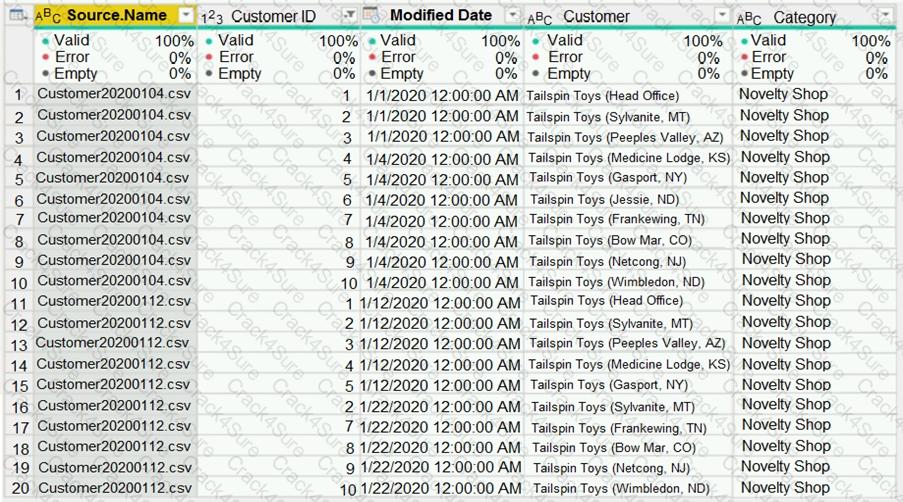
Each file contains deltas of any new or modified rows from each load to the data lake. Multiple files can have the same customer ID.
You need to keep only the last modified row for each customer ID.
Which three actions should you perform in sequence? To answer, move the appropriate actions from the list of actions to the answer area and arrange them in the correct order.
Which DAX expression should you use to get the ending balances in the balance sheet reports?
You have a source that contains a comumn. The column contains case sensitive date. You have a Power BI semantic model in DirectQuery mode. You connect to the model and discover that it contains undefined values and errors. You need to resolve the issue.
Solution: You change the semantic model mode.
Does this meet the goal?
You manage a Power BI model has a table named Sales and product.
You need to ensure that a sales team can view only data that has a CountryRegionName value of United States and a ProductCategory value of Clothing.
What should you do from Power BI Desktop?
You have a dataset that contains revenue data from the past year.
You need to use anomaly detection in Power Bl to show anomalies in the dataset.
What should you configure? To answer, select the appropriate options in the answer area.
NOTE: Each correct selection is worth one point.

You have a Power Bl report that contains a table visual The visual contains a column.
The column contains whole numbers ranging from o* 1 to 20.
You need to use conditional formatting to meet the following requirements:
• Visually compare the values without having to read the text containing the number.
• Show a different format for each distinct value
• Hide the numeric value of ColumnA.
• Minimize development effort.
Which formatting should you use?
You need to create a Power Bl theme that will be used in multiple reports. The theme will include corporate branding for font size, color, and bar chart
formatting.
What should you do?
You hove a folder that contains 50 JSON files.
You need to use Power 81 Desktop to make the metadata ol the files available as a single semantic model. The solution must NOT store the data of the JSON files.
Which type of data source should you use. and which transformation should you perform? To answer, select the appropriate options in the answer area.
NOTE: Each correct selection is worth one point.

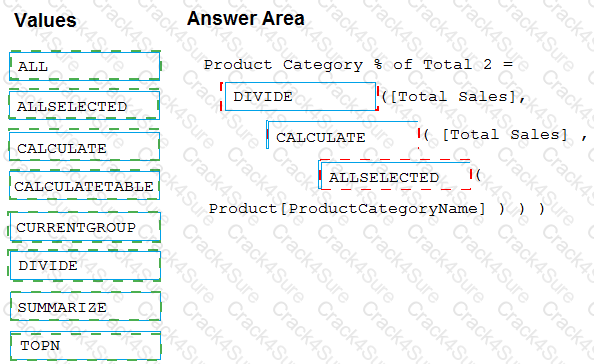
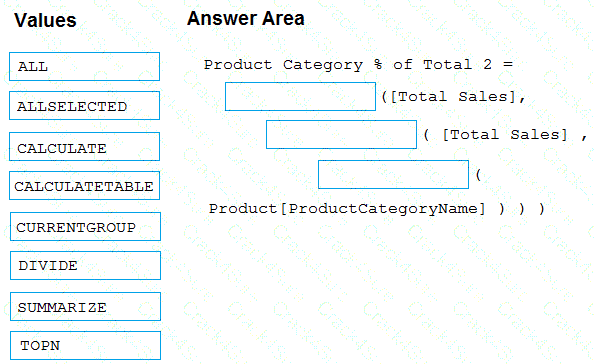
You have a Microsoft Power BI data model that contains three tables named Sales, Product, and Date.
The Sales table has an existing measure named [Total Sales] that sums the total sales from the Sales table.
You need to write a calculation that returns the percentage of total sales that a selected ProductCategoryName value represents. The calculation must respect any slicers on ProductCategoryName and must show the percentage of visible total sales. For example, if there are four ProductCategoryName values, and a user filters one out, a table showing ProductCategoryName and the calculation must sum up to 100 percent.
How should you complete the calculation? To answer, drag the appropriate values to the correct targets. Each value may be used once, more than once, or not at all. You may need to drag the split bar between panes or scroll to view content.
NOTE: Each correct selection is worth one point.
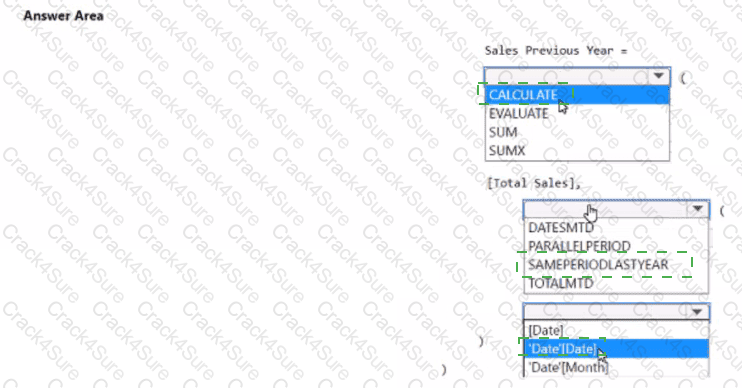
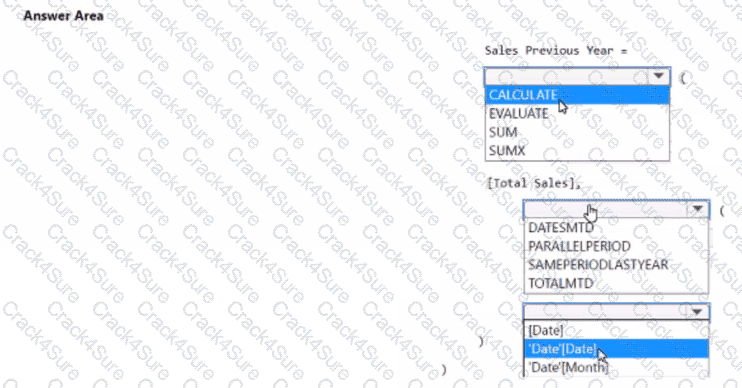
You have a Power BI model that contains a table named Sales and a related date table. Sales contains a measure named Total Sales You need to create a measure that calculates the total sales from the equivalent month of the previous year.
How should you complete the calculation? To answer, select the appropriate options in the answer area
NOTE: Each correct selection is worth one point.
3 Months Free Update
3 Months Free Update
3 Months Free Update

TESTED 10 Jul 2026