We at Crack4sure are committed to giving students who are preparing for the Oracle 1z0-1041-22 Exam the most current and reliable questions . To help people study, we've made some of our Oracle Cloud Platform Enterprise Analytics 2022 Professional exam materials available for free to everyone. You can take the Free 1z0-1041-22 Practice Test as many times as you want. The answers to the practice questions are given, and each answer is explained.
You want to create an Essbase cube using a MaxL script. This is the content of the Max! script:
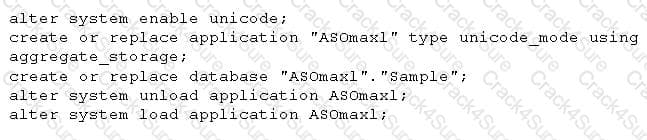
You saved the script file locally as cubeBuild.mx1, uploaded it to the cloud service, and executed a "MaxL script" job type. The job failed. What is the problem?
Which two statements pertaining toAction Links are false?
Your customer has an Essbase cube with current year P&L data. Once a month, the cube needs to be updated with the last closed month data.
How can the monthly data be loaded incrementally using Cube Designer?
Which of the following cannot be done with Data Visualization to shape stories?
What does a confusion matrix illustrate?
Your customer has a hybrid aggregate Essbase cube. They want to be able to model what-if scenarios with hypothetical data and are considering using the Sandbox dimension.
Which two statements represent correct functionality of the Sandbox dimension?
How should you use a machine learning model within a canvas of an Oracle Analytics Cloud project?

TESTED 11 Jul 2026