We at Crack4sure are committed to giving students who are preparing for the Qlik QSBA2021 Exam the most current and reliable questions . To help people study, we've made some of our Qlik Sense Business Analyst Certification Exam - February 2021 Release exam materials available for free to everyone. You can take the Free QSBA2021 Practice Test as many times as you want. The answers to the practice questions are given, and each answer is explained.
A business analyst is creating an app that requires several visualizations
• A scatter plot mat shows the margin percentage and total sales by product category
• A map with a the layer that visualizes lines between retail stores and lactones
• A KPI that shows total cost
Margin% can be calculated by dividing profit by revenue Profit is the difference between total cost and total sates
Which two sets of fields can the business analyst use to meet these requirements? (Select two.)
A business analyst needs to develop a visualization that compares performances of every product the company sells and each product category. The CEO wants to highlight the worst- and best-performing products and categories in a meeting that beg/is in one hour Using a bar chart which two approaches should the business analyst use? (Select two.)
The sales manager is investigating the relationship between Sales and Margin to determine if this relationship is linear when choosing the dimension Customer or Product Category
The sales manager wants to have the potential percentage Sales tor each Stage (initial to Won) of the sales process
What are the two correct visualizations?
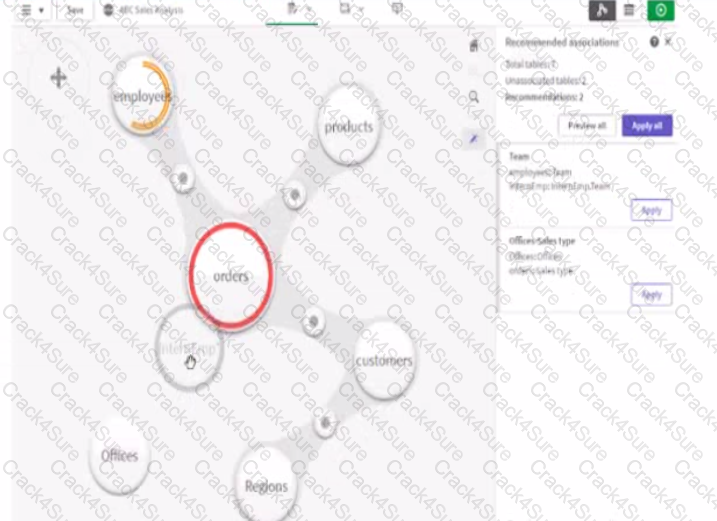
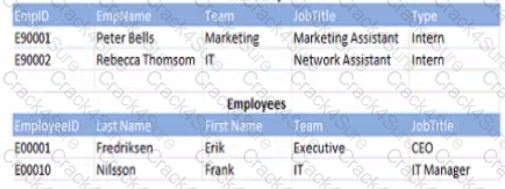
Refer to the exhibit.
A business analyst must add a list of interns to the current sates app. The app contains an existing employees table When the business analyst profiles the data the association vow displays possible associations as shown.
Which action should the business analyst take to meet the requirements?
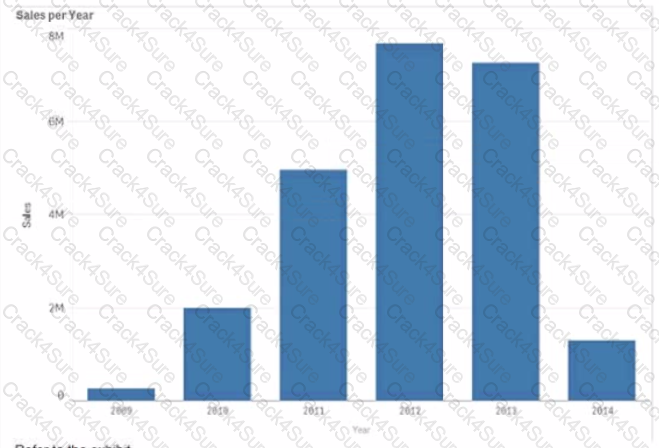
Refer to the exhibit.
A business analyst needs to display a bat chart only when less than 100 customers are selected
What should the business analyst create to meet this requirement
Refer to the exhibit.
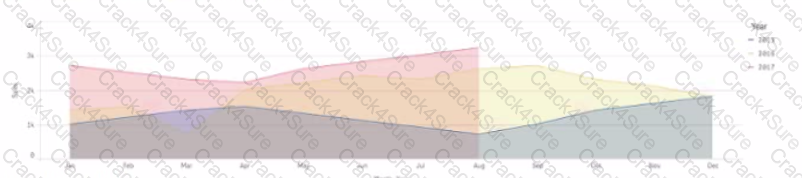
A CEO wants to use a similar visualization on the company's dashboards
The visualization must meet several requirements
• Show three years of sales data
• Display sales trends by month
• Allow comparison of years using an area style display
Which set of actions should a business analyst take to meet these requirements?
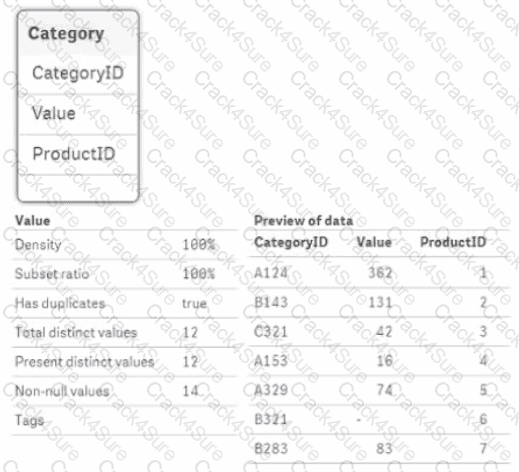
Refer to the exhibits
After the latest data reload a business analyst notices the value tor CategoryID 'B321' seems different What is causing this discrepancy?
A business analyst needs to share a link to a specific visualization with colleagues
Which steps should the business analyst use?
The business analyst needs to see now me same data wil appear m other chart types Which steps should the business analyst take to meet these requirements?
A company that manages several tennis clubs uses an app mat includes three master measures TotalCost, Totallncome. and TotalMargin A business analyst needs to create a new table that utilizes master items and meets the following requirements:
• Number of bookings that users make
• Cost associated with booking (including electricity and indirect costs)
• Income obtained and profit originated m each booking
• Sales margin: percentage of margin over income
• Detail by tennis clubs
Which optimal expressions should the business analyst use?
3 Months Free Update
3 Months Free Update
3 Months Free Update

TESTED 09 Jul 2026