We at Crack4sure are committed to giving students who are preparing for the Qlik QSBA2024 Exam the most current and reliable questions . To help people study, we've made some of our Qlik Sense Business Analyst Certification Exam-2024 exam materials available for free to everyone. You can take the Free QSBA2024 Practice Test as many times as you want. The answers to the practice questions are given, and each answer is explained.
Refer to the exhibit.
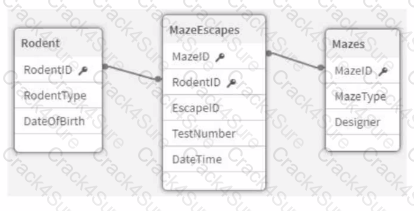
An app that will track experiments for rodents (e.g., rats and mice) that navigate mazes (labyrinths) is being developed. Individual rodents are catalogued in the Rodent table, while the Mazes table has metadata for the mazes. The MazeEscapes table holds a record of each attempt at a maze by a rodent. A business analyst needs to build a KPI that will allow users to see how many rodents have made at least one attempt at any maze.
How should the analyst construct the KPI?
Refer to the exhibit.
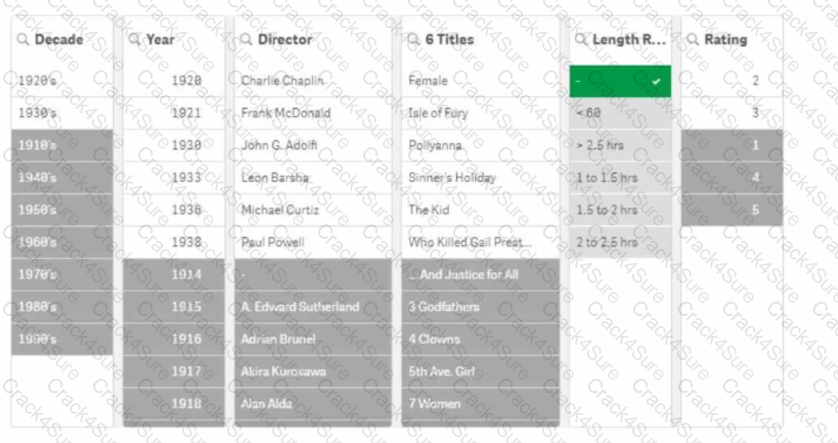
A movie analyst is using an app to gain insights into films created in the early 20th century. The analyst reviews the filter for Length Range, notices a hyphen "-", and selects it.
What can the analyst determine from the resulting filter panes?
A business analyst is working with a customer to refine the end user experience. The customer has the following requirements:
• Ability to provide these charts to a specific user group
• Minimize the number of navigation clicks between charts
• Achieve fastest screen response time when switching between charts
• Maximize the chart size in terms of screen real estate
Which action should the business analyst take to meet the requirements?
A business analyst needs to build a chart that enables users to analyze the correlation between the following measures for all products:
• Product Sales ($)
• Order Volume
• Margin%
Which visualization should the business analyst use?
The VP of Sales asks a business analyst to include a KPI object on the sales dashboard that shows total sales value for the year 2022, regardless of selections. Existing fields in the data model include Sales and Year.
How should the business analyst write the measure for the KPI object?
A business analyst is creating a new app with sales data. The visualizations must meet several requirements:
A Bar chart that shows sales by product group is used in multiple sheets
• A KPI object that visualizes that the total amount of sales is used once
• A Treemap that shows margin by product group is used one time inside a Container
Which visualization should be added to the master items library?
A business analyst using a shared folder mapped to S:\488957004\ receives an Excel file with more than 100 columns. Many of the columns are duplicates. Any current columns that should be used have the suffix '_c' appended to the column name.
Which action should the business analyst take to load the Excel data?
A business analyst is developing an app that contains a data model with fields: Country, City, Sales, ProductName, and ProductCategory. The global sales manager wants to add new visualizations to this app.
The business analyst must include the following:
• Ability to dynamically change the number of countries and cities
• Display a maximum of 10 countries
• Display a maximum of 5 cities per country
Which steps should the business analyst take?
An app needs to load a few hundred rows of data from a .csv text file. The file is the result of a concatenated data dump by multiple divisions across several countries. These divisions use different internal systems and processes, which causes country names to appear differently. For example, the United States of America appears in several places as 'USA', 'U.S.A.', or 'US'.
For the country dimension to work properly in the app, the naming of countries must be standardized in the data model.
Which action should the business analyst complete to address this issue?
A company has sales data where every Customer ID can be assigned to one or more Sales Account ID. Sales Accounts are assigned to one of eight Groups. The business analyst is creating an app with the following requirements:
• Each Group should have a separate sheet
• The Sales Account can only see its own customers
• The Sales Account can navigate only to the sheet for the Group assigned
The business analyst has created a Section Access table, in which each Sales Account ID is assigned their CustomerlDs. Which action should the business analyst take next?
3 Months Free Update
3 Months Free Update
3 Months Free Update

TESTED 09 Jul 2026