We at Crack4sure are committed to giving students who are preparing for the Qlik QSDA2021 Exam the most current and reliable questions . To help people study, we've made some of our Qlik Sense Data Architect Certification Exam - February 2021 Release exam materials available for free to everyone. You can take the Free QSDA2021 Practice Test as many times as you want. The answers to the practice questions are given, and each answer is explained.
Refer to the exhibit.
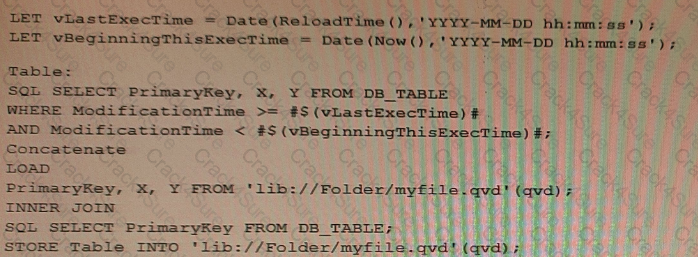
Which changes on the database will the script capture?
The Marketing department is using some similar KPIs in different apps that need to be modified frequently according to the business needs. The KPIs are created using master items with the same expression.
Which method should the data architect use to manage the modifications in all apps?
Refer to the exhibit.
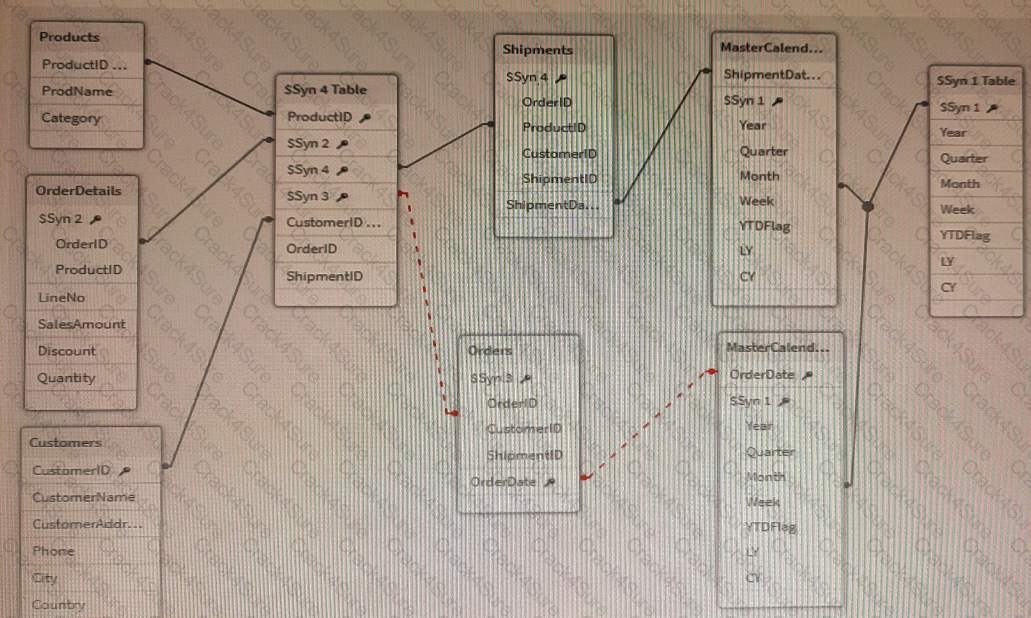
A data architect is working on a Qlik Sense app the business has created to analyze the company orders and shipments. To understand the table structure, the business has given the following summary:
• Every order creates a unique orderlD and an order date in the Orders table
• An order can contain one or more order lines one for each product ID in the order details table
• Products in the order are shipped (shipment date) as soon as tliey are ready and can be shipped separately
• The dates need to be analyzed separately by Year Month, and Quarter
The data architect realizes the data model has issues that must be fixed.
Which steps should the data architect perform?
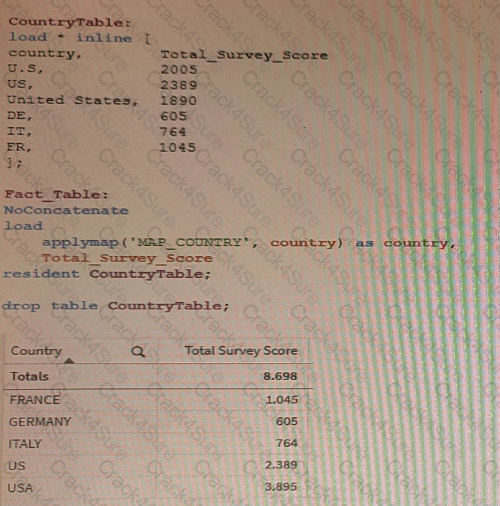
On executing a load script of an app, the country field needsto be normalized.The developer uses a mapping table to address the issue.
What should the data architect do?
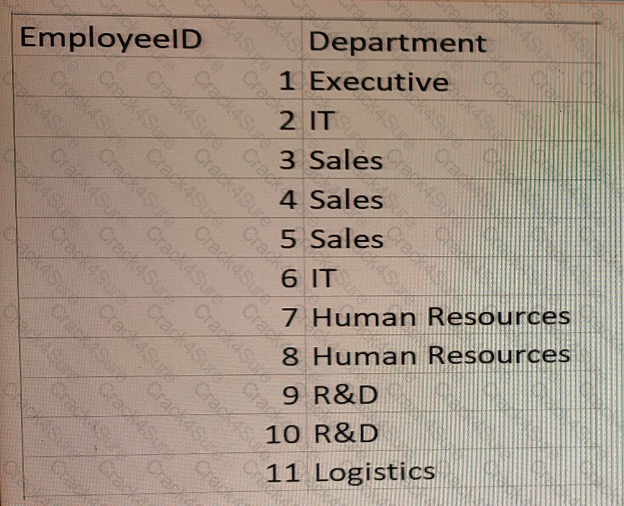
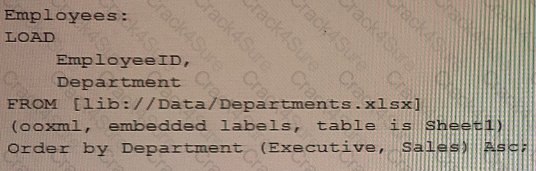
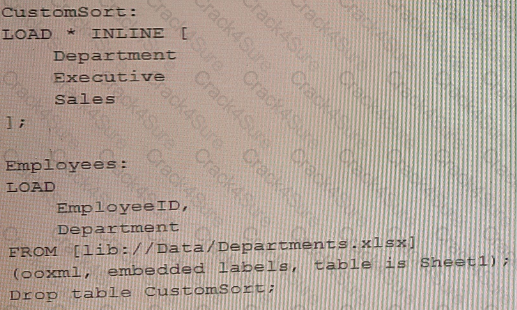
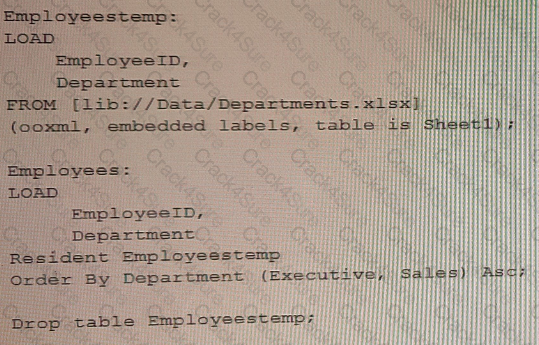
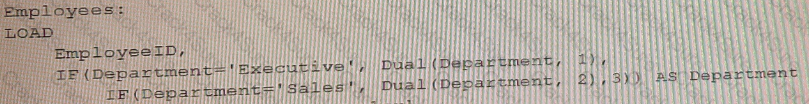
A company has different departments. Executive and Sales should always be the first values in aDepartment filter pane. Which script must the data architect use to meet this requirement?
A)
B)
C)
D)
A data architect of an organization that has implemented Qlik Sense on Windows needs to load large amounts of data from a database that is continuously updated
New records are added, and existing records get updated and deleted. Each record has a LastModified field.
All existing records are exported into a QVD file. The data architect wants to load the records into Qlik Sense efficiently.
Which steps should the data architect take to meet these requirements?
A company generates 1 GB of ticketing data daily.The data is stored in multiple tables Business users need to see trends oftickets processed for the past.2 years Users very rarely access the transaction-level data for a specific date.Only the past 2 years of data must be loaded which is 720 GB of data
Which method should a data architect use to meet these requirements?
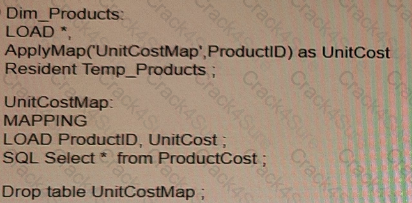
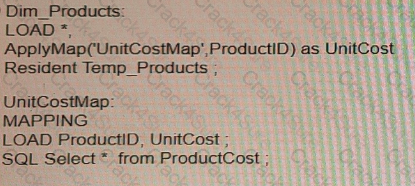
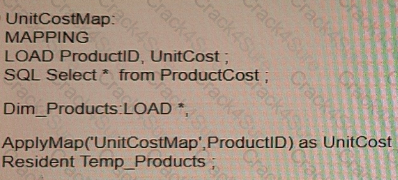
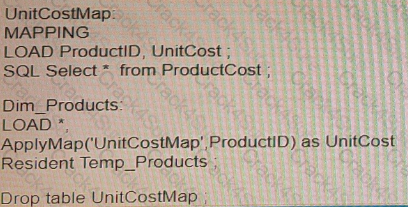
A data architect needs to add the UnitCost field from the ProductCost table in the Dim_Products Table.
Which script code should the data architect use?
A)
B)
C)
D)
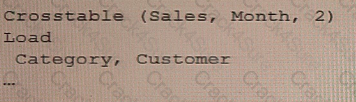
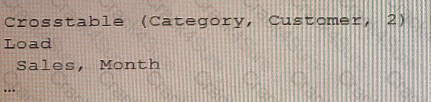
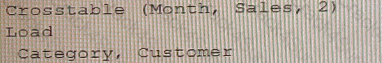
Refer to the exhibit.
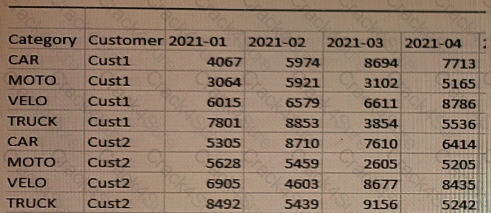
A customer needs to load forecast data from an Excel file.
Which preceding load statement should the data architect use to load the data?
A)
B)

C)
D)
A data architect needs to upload data from ten different sources, but only if there are any changes after the last reload When data is updated, a new file is placed into a folder mapped to E A439926003 The data connection points to this folder.
The data architect plans a script which will:
1.Verify that the file exists
2. If the file exists, upload it Otherwise, skip to the next piece of code
The script will repeat this subroutine for each source. When the script ends, all uploaded files will be removed with a batch procedure.
Which option should the data architect use to meet these requirements?
3 Months Free Update
3 Months Free Update
3 Months Free Update

TESTED 09 Jul 2026