Summer Special - 65% Discount Offer - Ends in 0d 00h 00m 00s - Coupon code: c4sdisc65

QV12BA PDF

$38.5

$109.99

3 Months Free Update

  • Printable Format
  • Value of Money
  • 100% Pass Assurance
  • Verified Answers
  • Researched by Industry Experts
  • Based on Real Exams Scenarios
  • 100% Real Questions

QV12BA PDF + Testing Engine

$61.6

$175.99

3 Months Free Update

  • Exam Name: QlikView 12 Business Analyst Certification Exam
  • Last Update: Sep 12, 2025
  • Questions and Answers: 50
  • Free Real Questions Demo
  • Recommended by Industry Experts
  • Best Economical Package
  • Immediate Access

QV12BA Engine

$46.2

$131.99

3 Months Free Update

  • Best Testing Engine
  • One Click installation
  • Recommended by Teachers
  • Easy to use
  • 3 Modes of Learning
  • State of Art Technology
  • 100% Real Questions included

QV12BA Practice Exam Questions with Answers QlikView 12 Business Analyst Certification Exam Certification

Question # 6

Refer to the exhibit.

QV12BA question answer

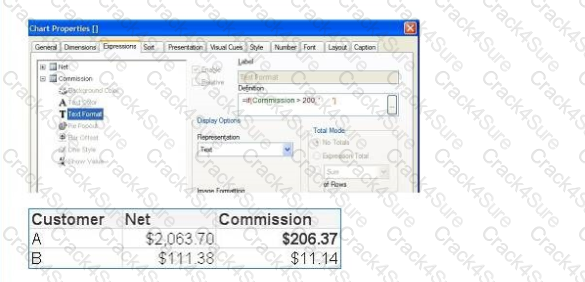
A business analyst creates a straight table to display net sales and commissions. The table uses the Anal font by default. The analyst will use a Text Format Expression to show commissions greater than $200 in Arial Bold font.

Which is the correct expression?

A.

=If(Conroission > 200, *')

B.

=If(Conroission > 200, 'Bold1)

C.

=If(Conroission > 200, 'Arial Bold')

D.

=If (Coitinission > 200, * Commissior.' )

Full Access
Question # 7

An Invoices table has a DaysOverdue field A chart is required to analyze overdue invoices in 30 day intervals Which function should a business analyst use to meet this requirement?

A.

Aggr (DaysOverdue,30)

B.

Class(DaysOverdue, 30)

C.

GroupBy(DaysOverdue,30)

D.

IntervalMatch(DaysOverdue,30)

Full Access
Question # 8

Refer to the exhibit

QV12BA question answer

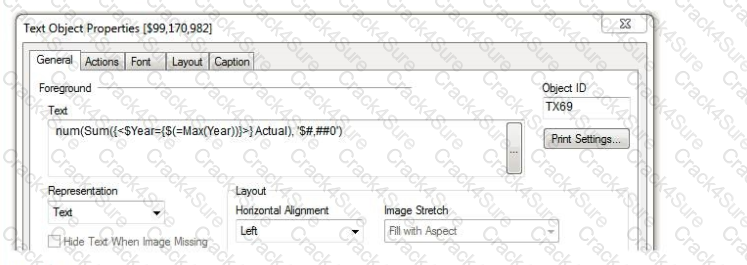
A business analyst needs to present the actual sales of the current year in a KPI on a dashboard. The expression in the Text field is NOT working

Which two changes will correct the expression? (Select two )

A.

Remove the $ sign before Year

B.

Remove the $ sign between {and (

C.

Add single quotes around the whole expression

D.

Change Representation from Text to Expression

E.

Add a = sign at the beginning of the expression

Full Access
Question # 9

A business analyst needs to analyze average sales by product number and country by year. Which measure(s) should the business analyst use?

A.

Year

B.

Average Sales

C.

Average Sales and Year

D.

Product Number and Average Sales

Full Access
Question # 10

A business analyst needs to sort the values for the Product dimension explicitly as "Planes", then "Trains", then "Automobiles" The analyst needs a highly optimized solution to provide the best performance for an application with between 900 million and 1 billion records

Which solution should the analyst use?

A.

Use the Ord function in the user interface to sort in a custom order

B.

Build nested IF statements in the user interface to assign numeric values, then sort numerically

C.

Create a new calculated dimension in the Ul named ProductSort, then sort the Product field by the new ProductSort field

D.

Assign a numeric value to the Product values using the DUAL function during the data load, then sort numerically in the Ul

Full Access
Question # 11

A customer needs to see sales data by month, with a rolling six month average of margin percent for any selected twelve month period. Which chart will meet these requirements?

A.

A combo chart of sales as bars and rolling six month average margin percent as a line by Month Year

B.

A pie chart of sales by Month Year and a line chart of rolling six month average margin percent by MonthYear

C.

A bar chart of sales by month by year and a straight table of rolling six month average margin percent by MonthYear

D.

A trellis chart of bar charts as sales by month by year and a pivot table of rolling six month average margin percent by month by year

Full Access
Question # 12

A business analyst needs to visualize the sales of products by product category, product sub-category, and product name. The analyst would like to see the relative sales by product hierarchy without using a drill-down dimension.

Which chart type should the analyst use?

A.

Grid chart

B.

Block chart

C.

Combo chart

D.

Radar chart

Full Access
Question # 13

A business analyst needs to create a dashboard showing only numerical values. There is NO need to filter data or select any

dimensions.

Which three objects can the business analyst use? (Select three )

A.

Bar chart

B.

Grid chart

C.

Gauge chart

D.

Scatter chart

E.

Straight table

Full Access
Question # 14

Refer to the exhibit.

QV12BA question answer

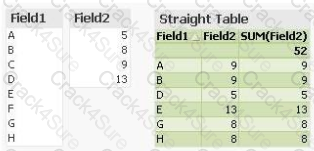
The straight table does NOT show all rows from the Field1 list box What does this indicate about the dataset?

A.

Field2 is a synthetic key

B.

A synthetic key is required

C.

Field2 contains null values

D.

Field2 contains blank values

Full Access
Question # 15

Refer to the exhibit.

QV12BA question answer

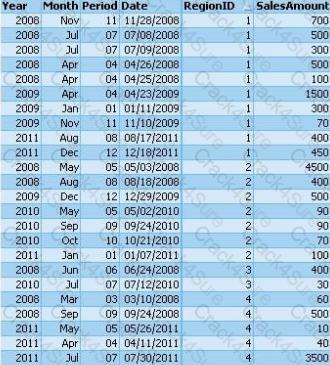
The Sales table shown represents the entire data set A business analyst adds an expression in a document:

QV12BA question answer

Next, the analyst selects Year = '2010' and RegionID = '2\. What is the result of the expression with these selections?

A.

250

B.

750

C.

850

D.

650

Full Access