We at Crack4sure are committed to giving students who are preparing for the Tableau Desktop-Specialist Exam the most current and reliable questions . To help people study, we've made some of our Tableau Desktop Specialist Exam exam materials available for free to everyone. You can take the Free Desktop-Specialist Practice Test as many times as you want. The answers to the practice questions are given, and each answer is explained.
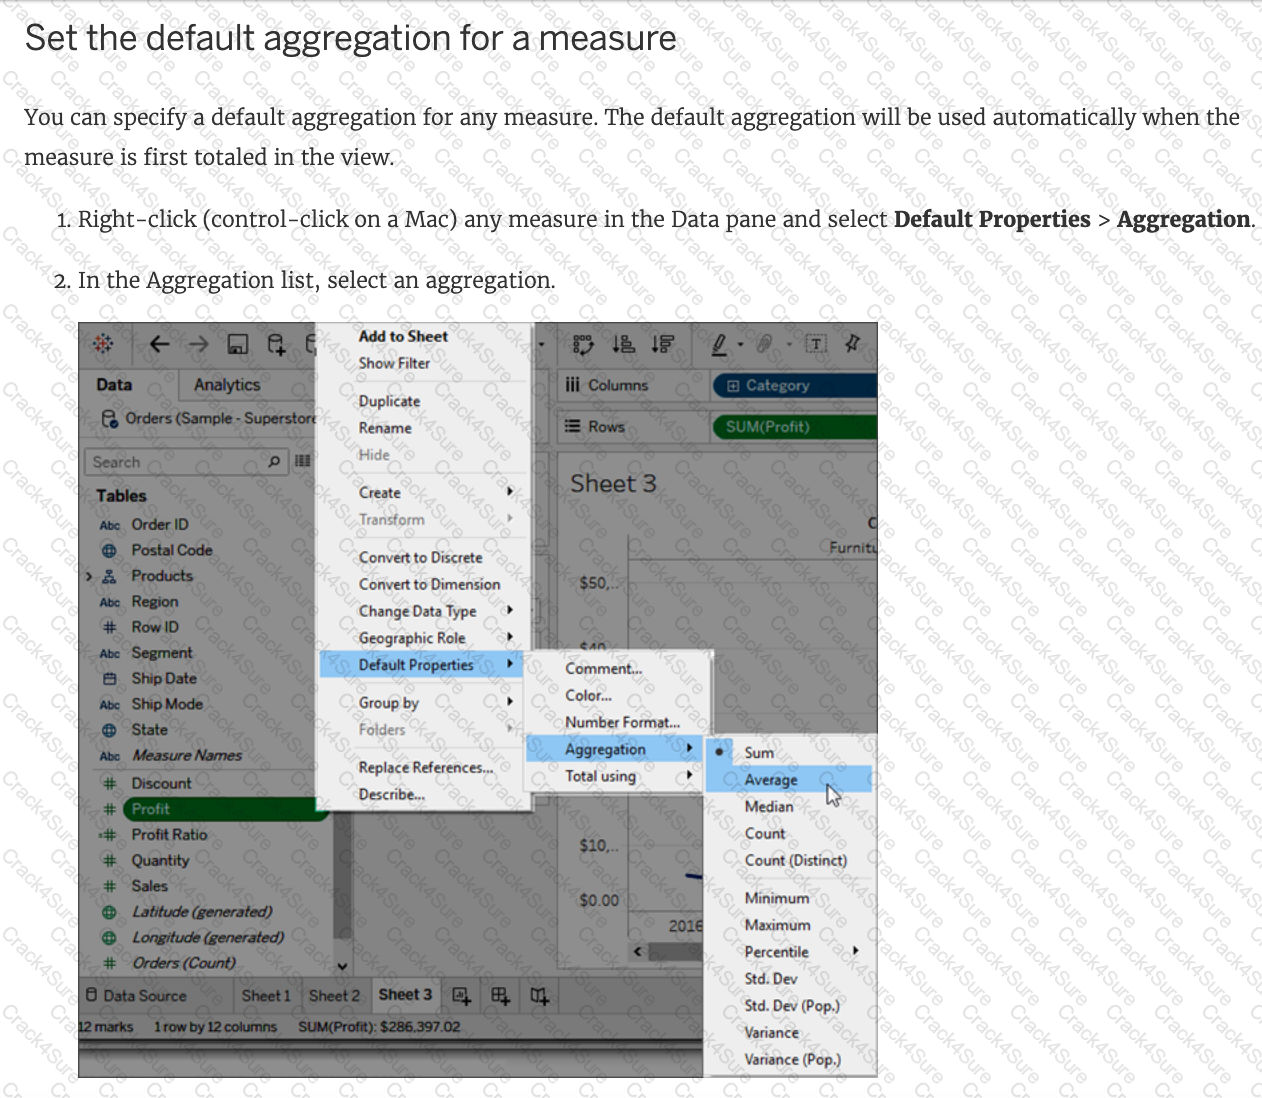
How can you change the Default Aggregation for a measure in Tableau?
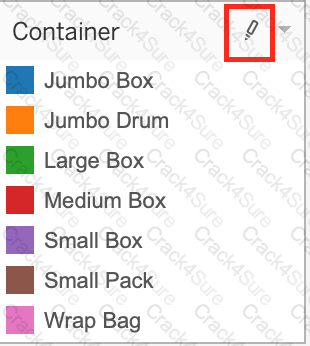
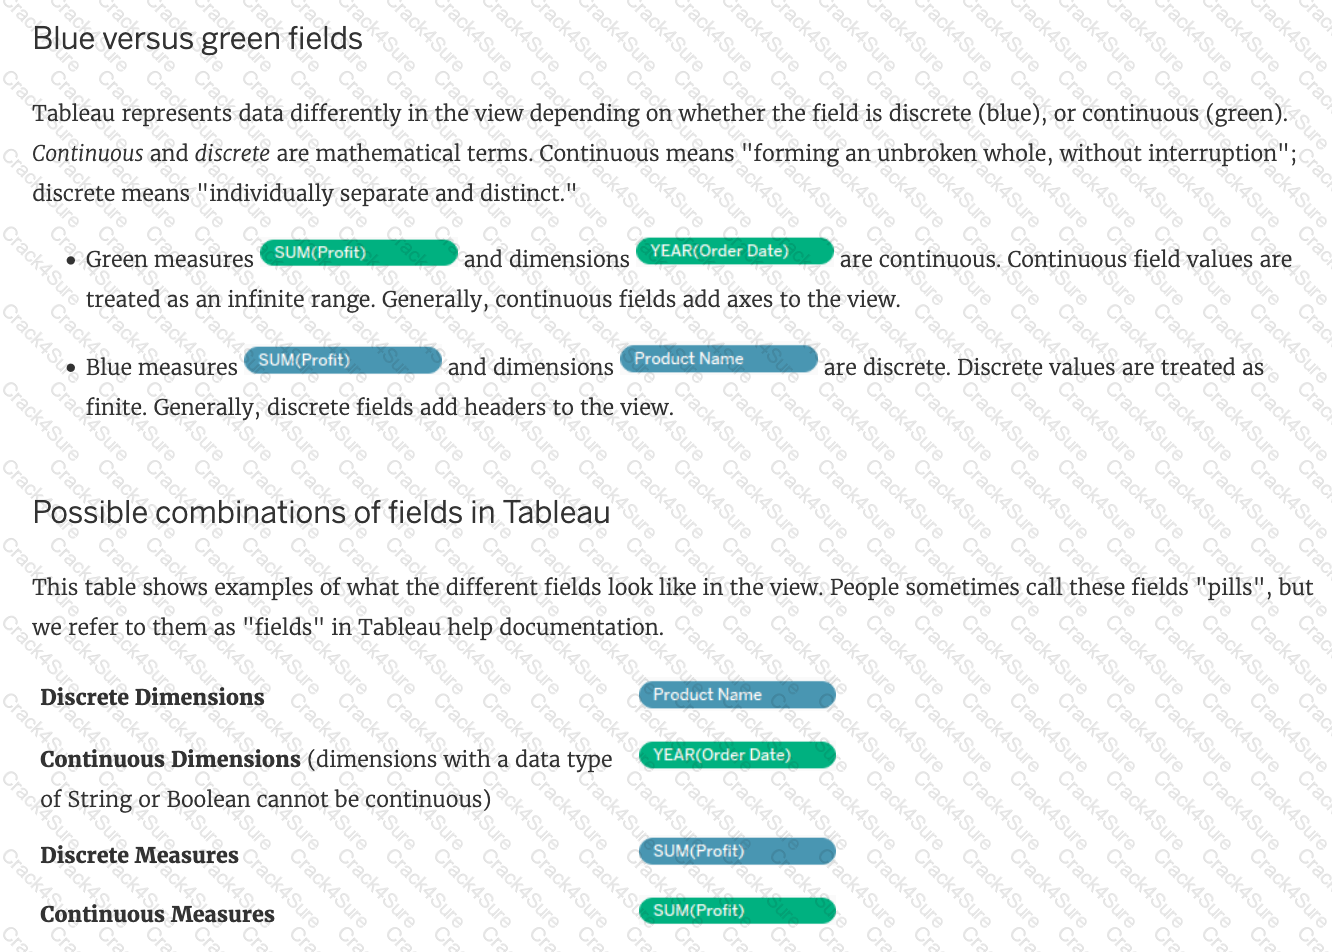
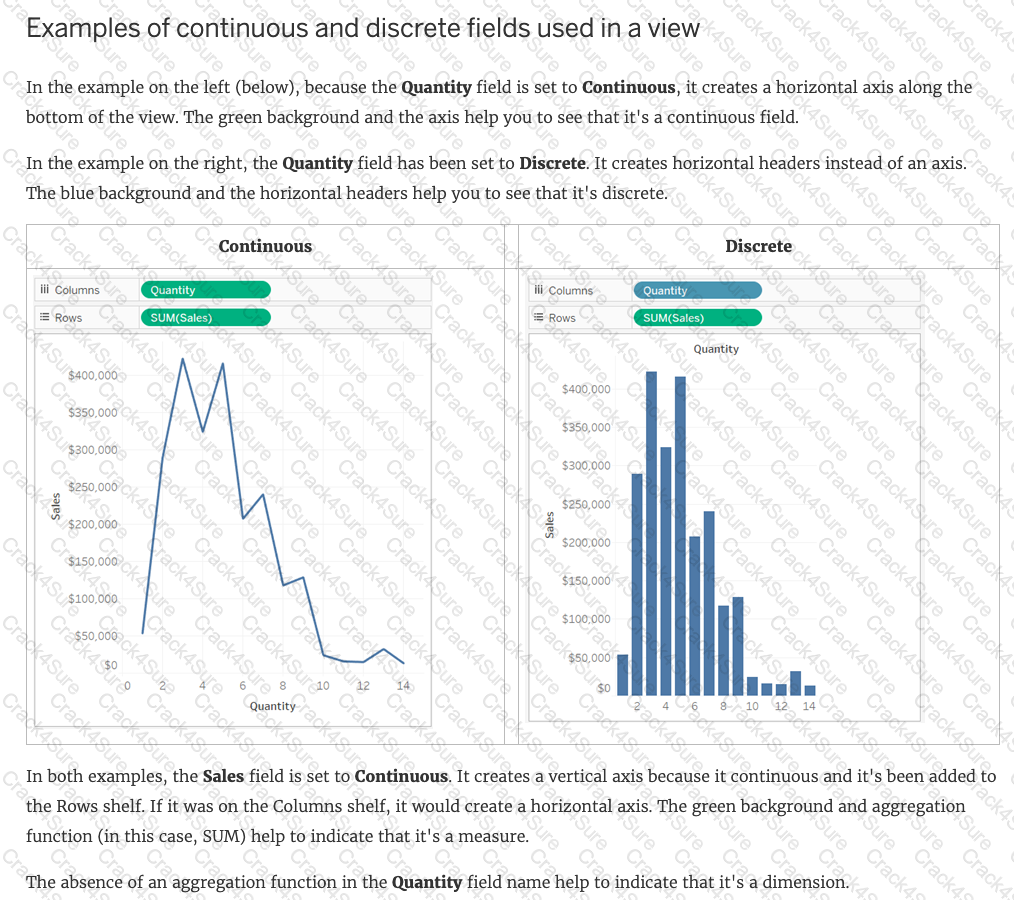
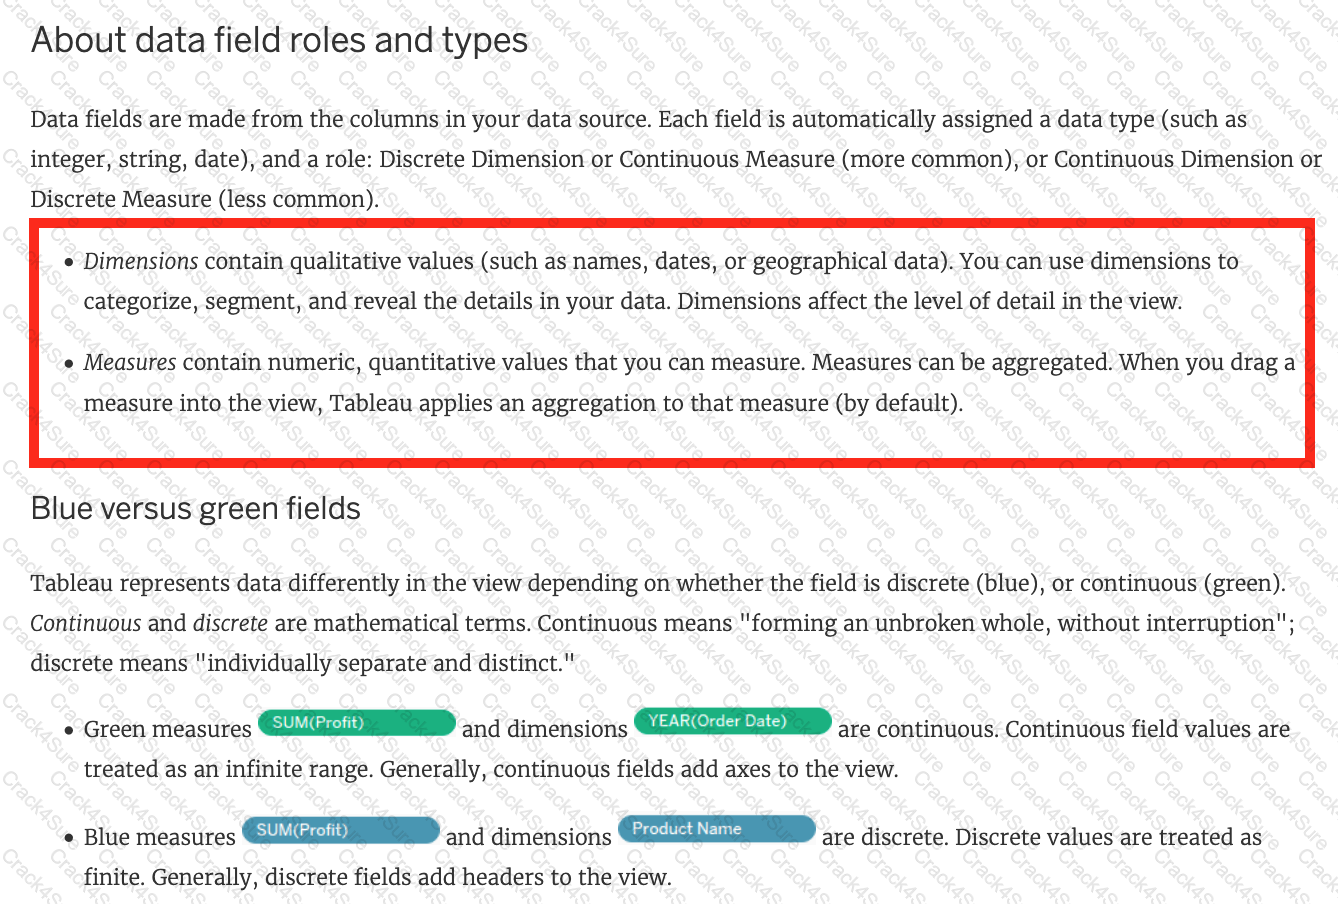
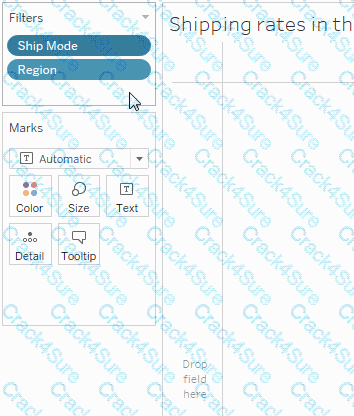
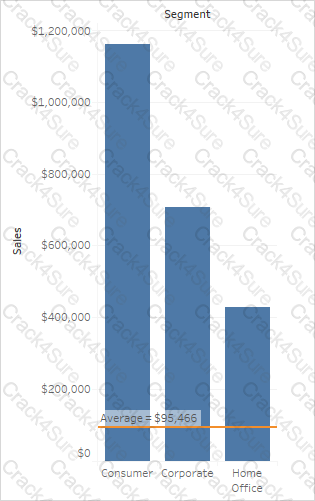
What do the colours Blue and Green represent in Tableau?
For which of the following charts, does the Size option on the Marks card not work?
For creating variable sized bins we use __________________
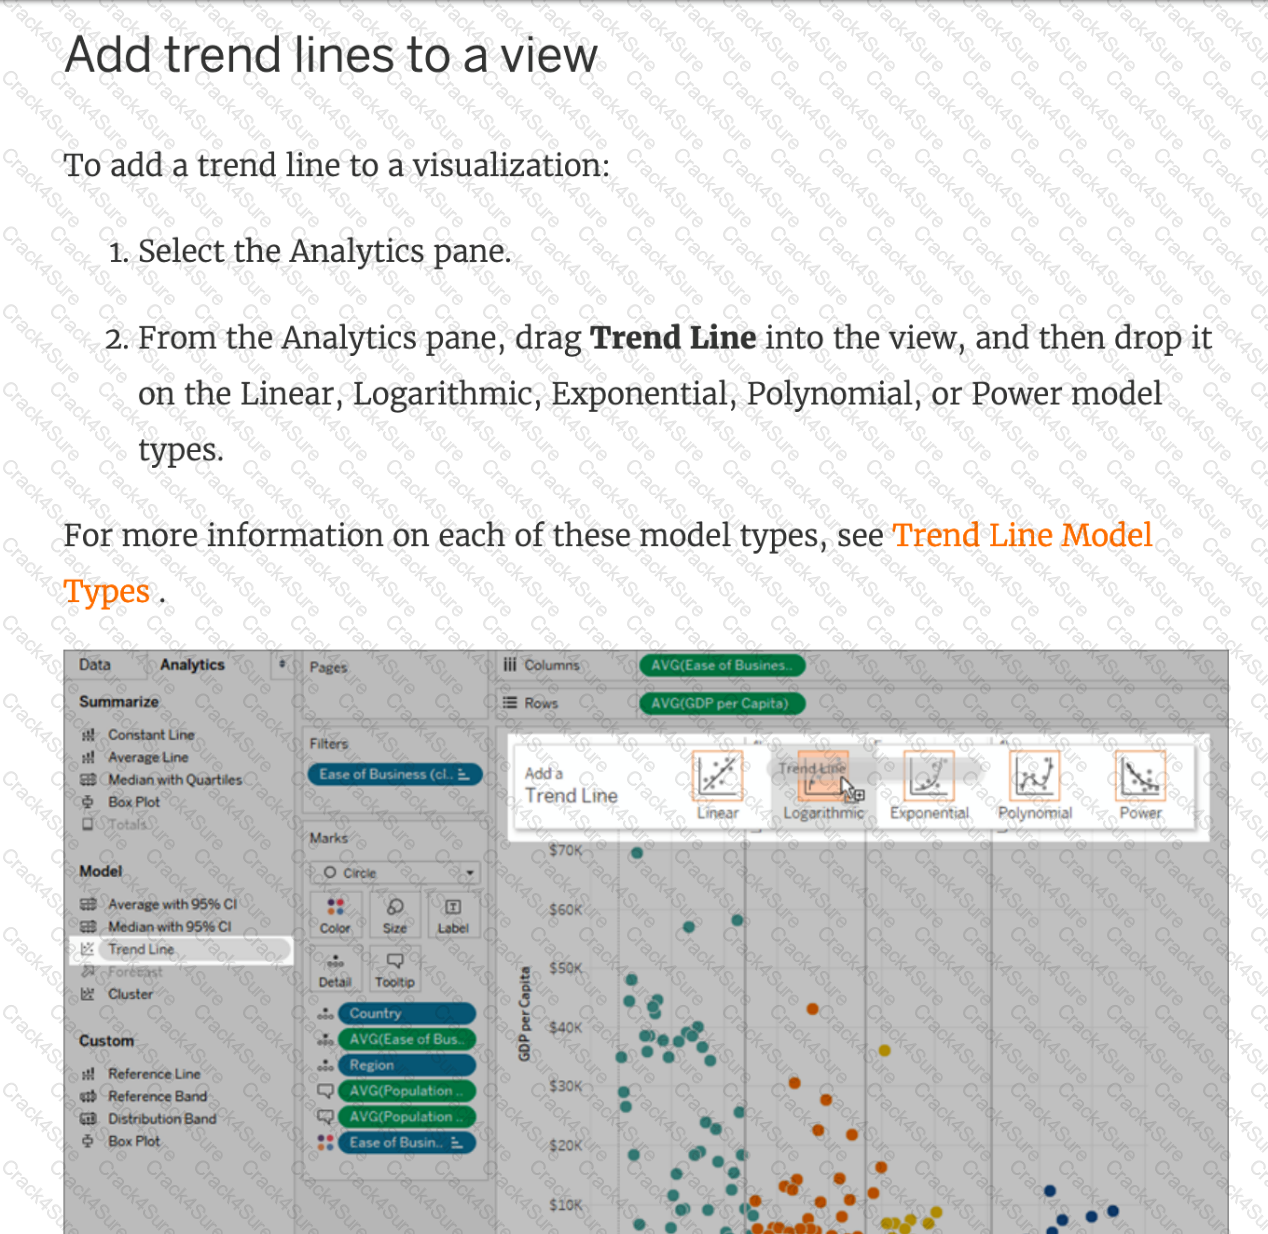
Which of the following is not a Trend Line Model?
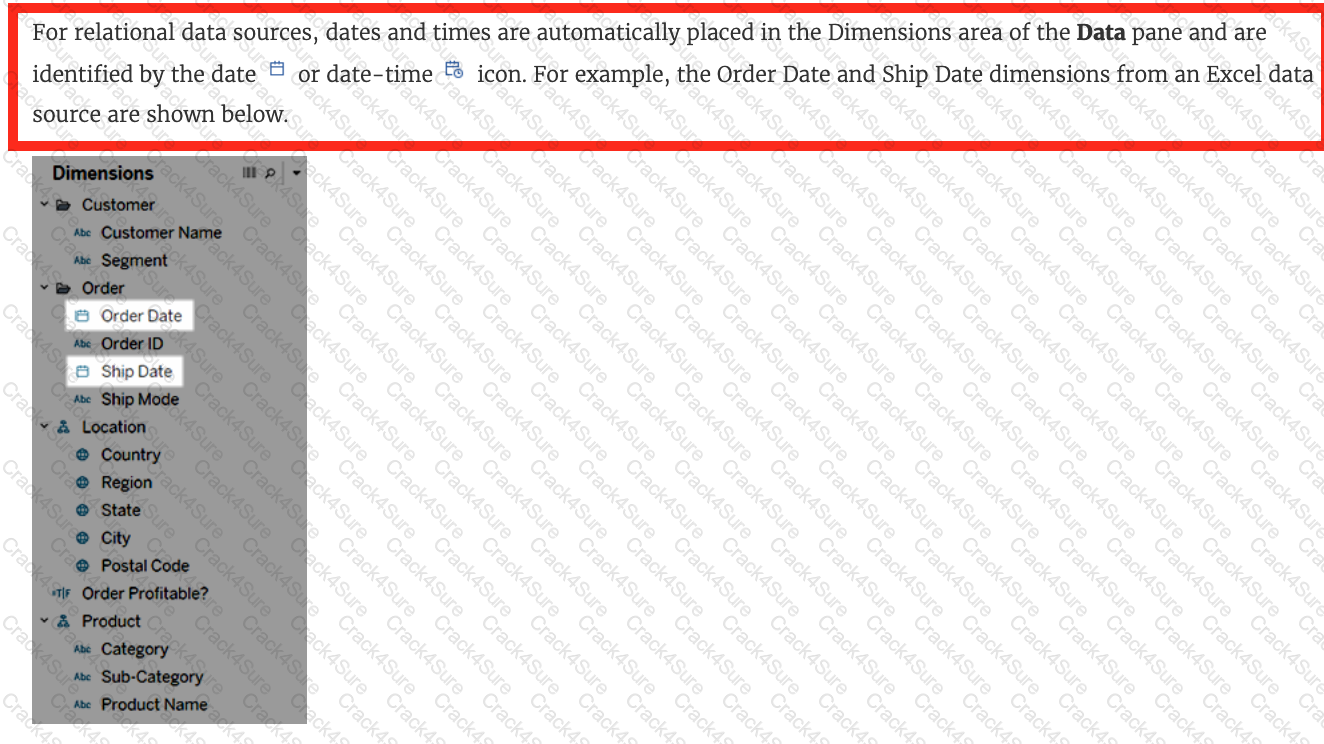
Which of the following 2 fields CANNOT be deleted in Tableau?
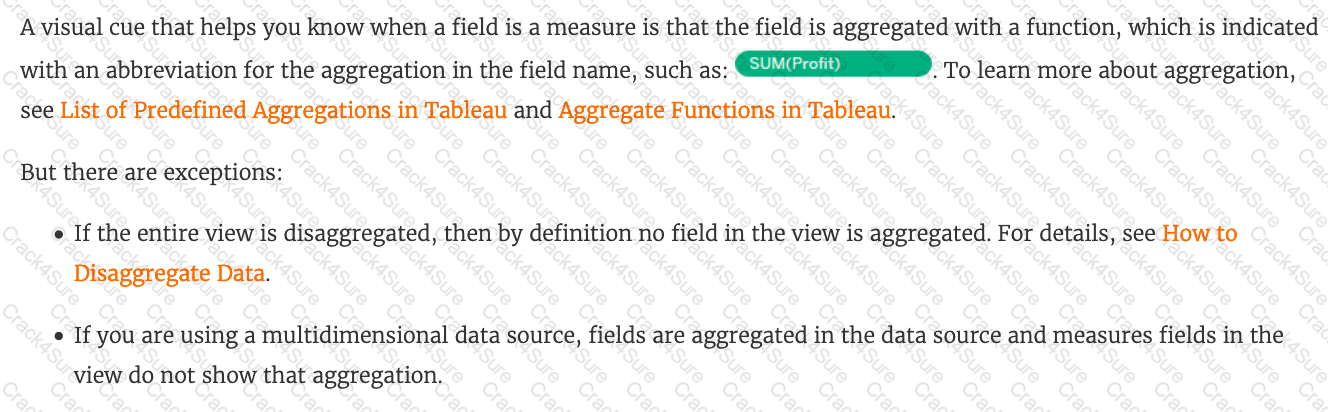
Which of the following options best describe measures?
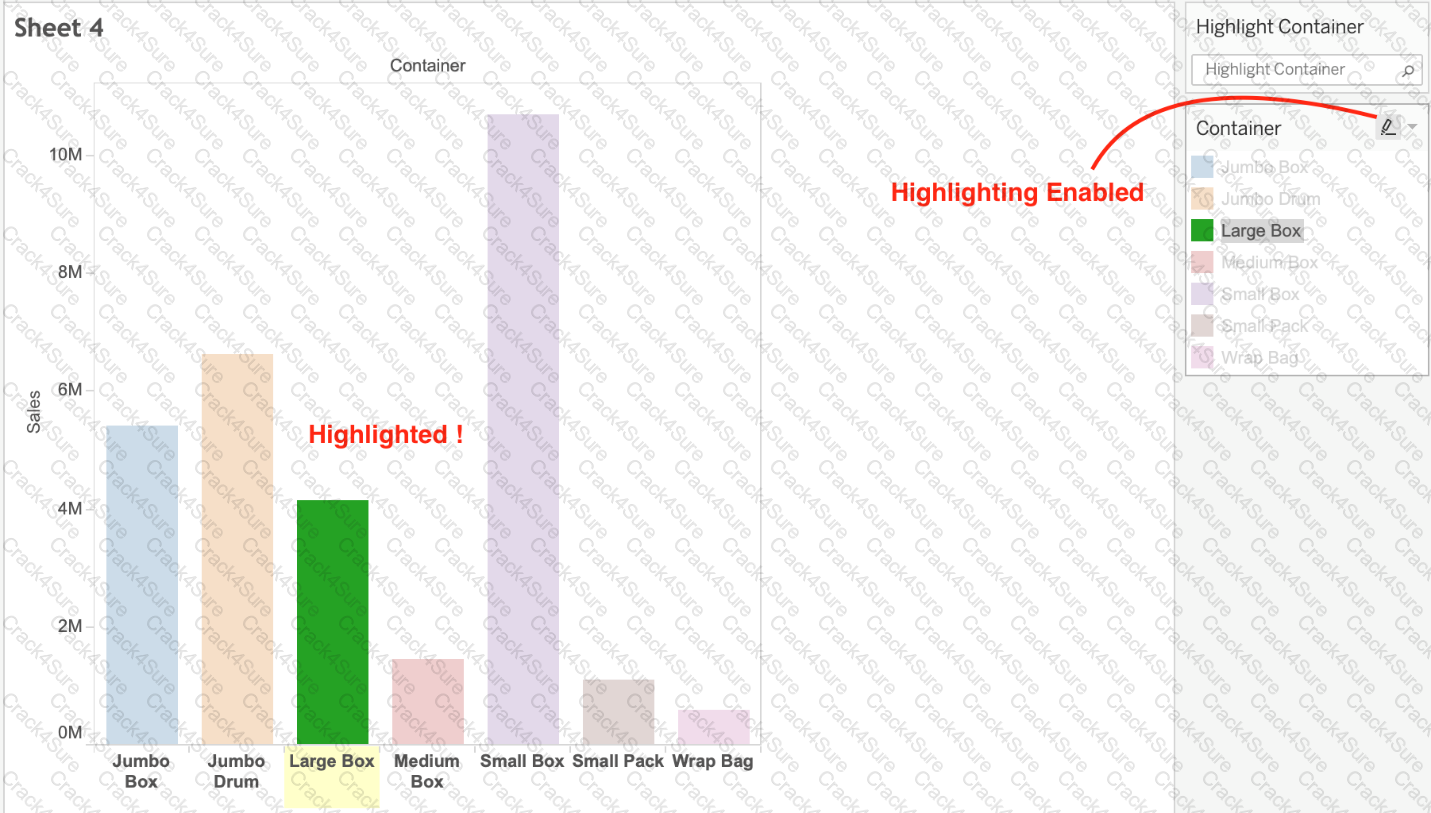
What does the following marker/icon do in Tableau?
Which of the following would you use to connect to multiple tables in a single data source at once?
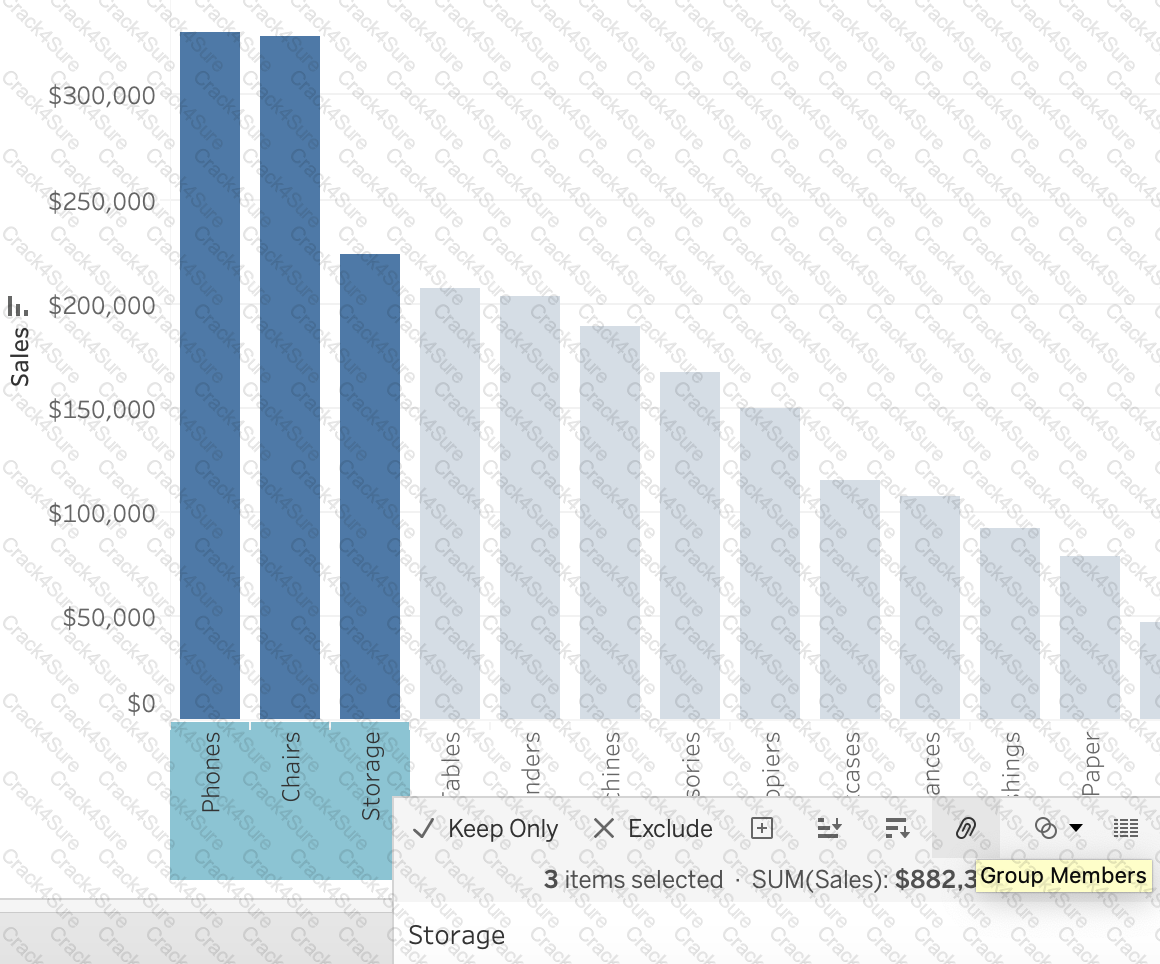
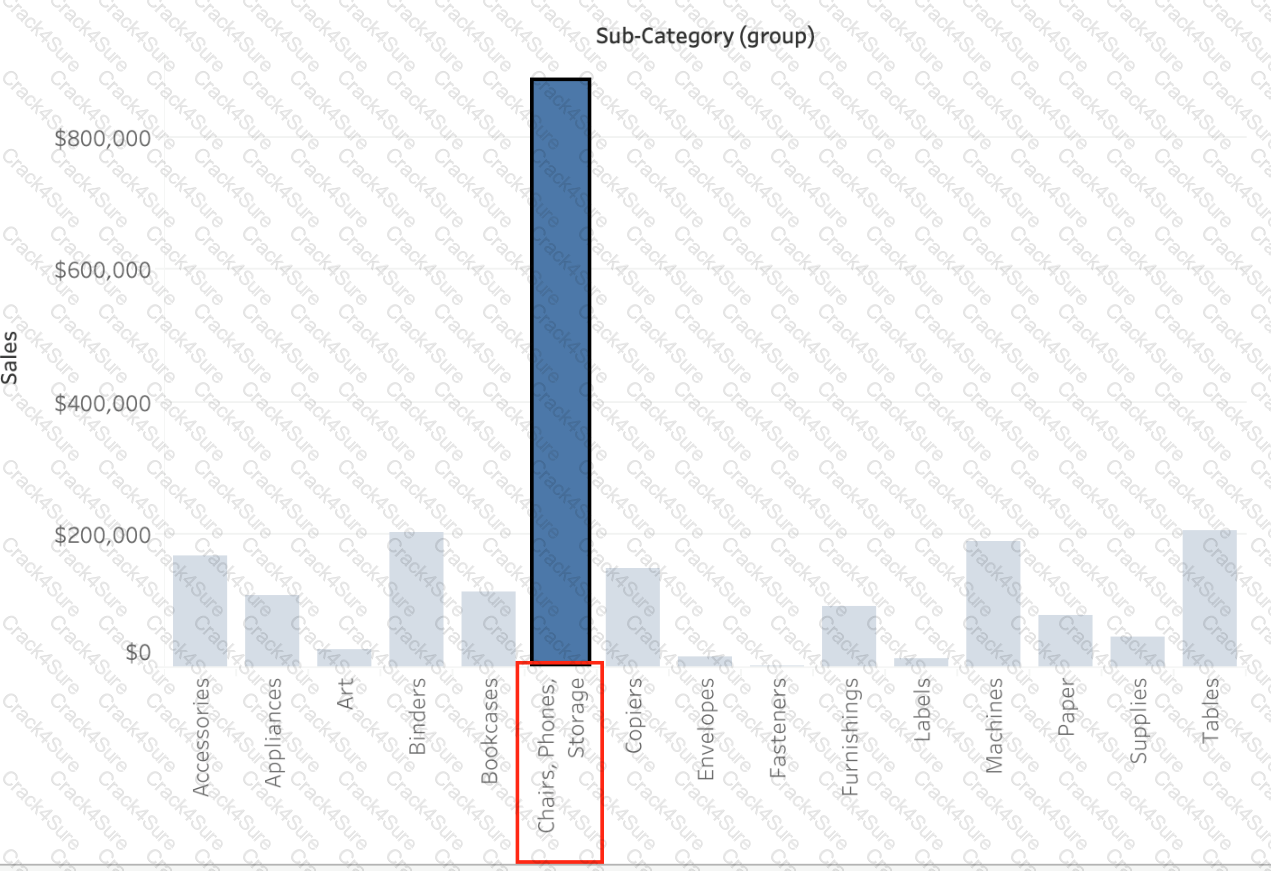
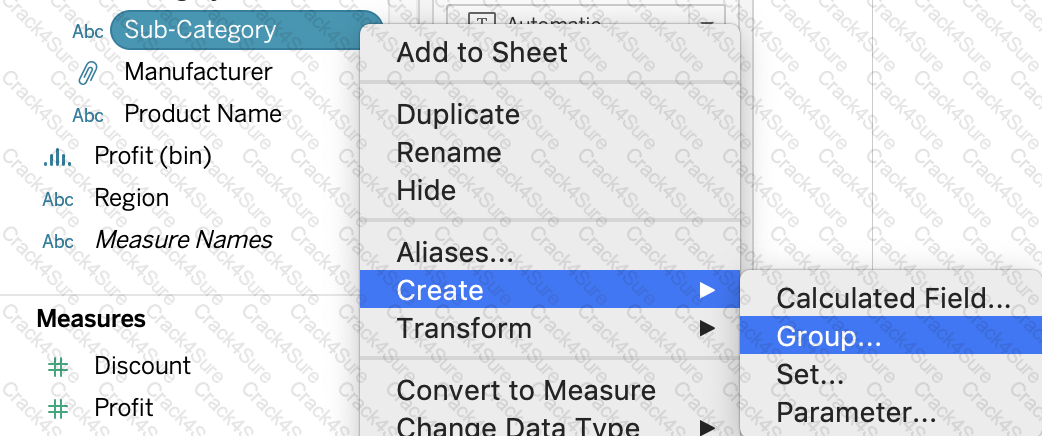
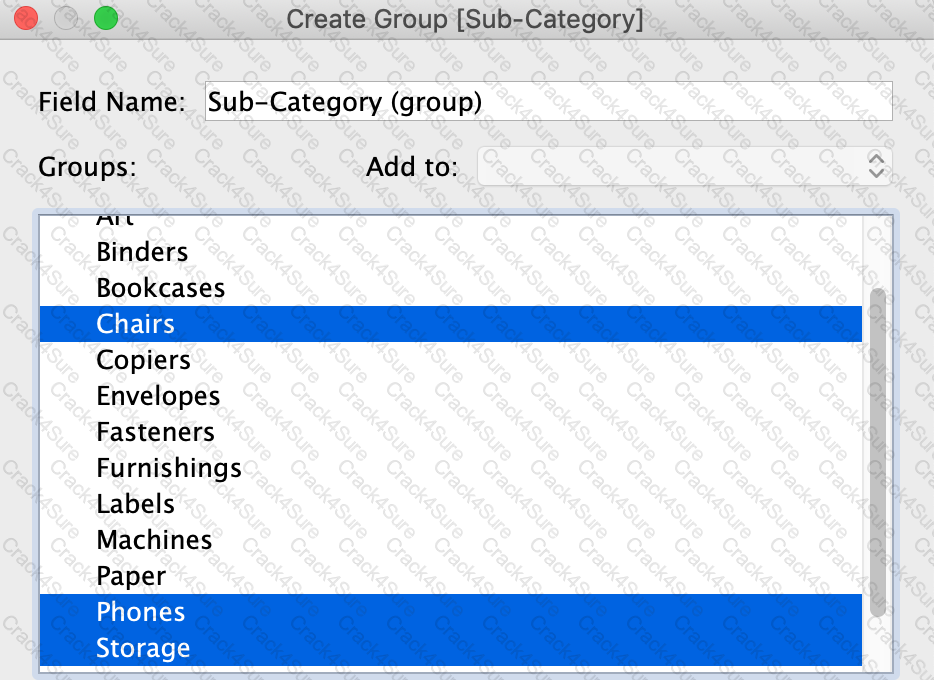
Which of the following are valid ways of Grouping Data?
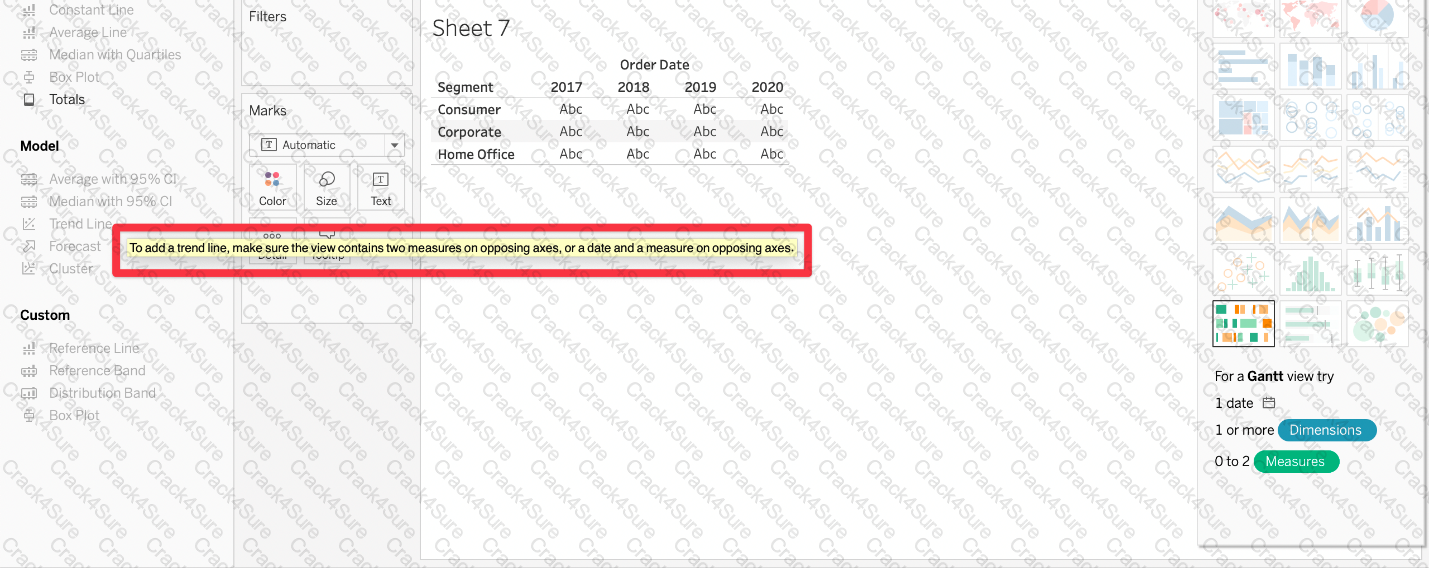
Which of the following are required to create a trend line?
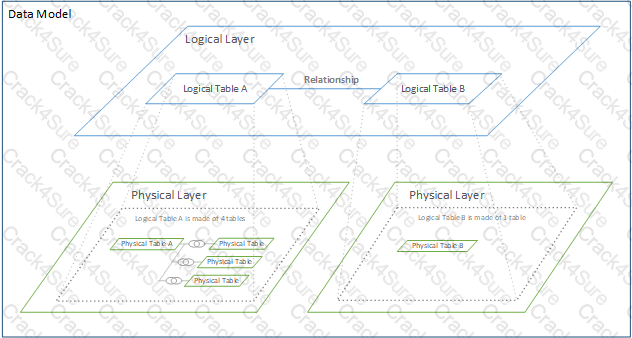
True or False: Physical tables remain distinct (normalized), not merged in the data source whereas logical tables are merged into a single, flat table.
Which of the following are benefits of using Data Extracts in Tableau?
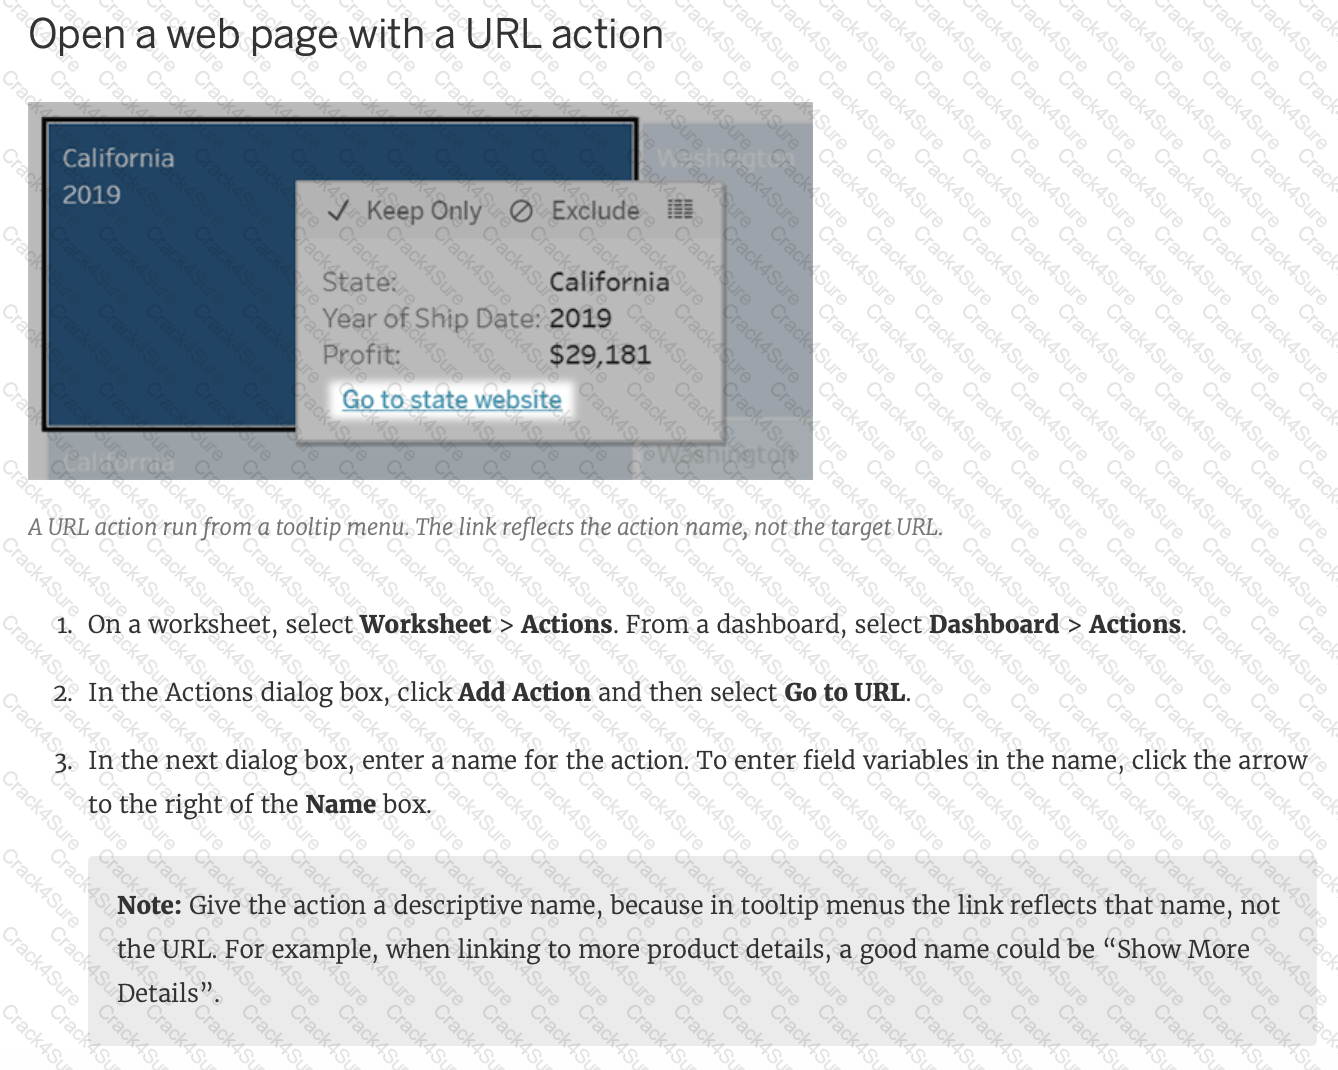
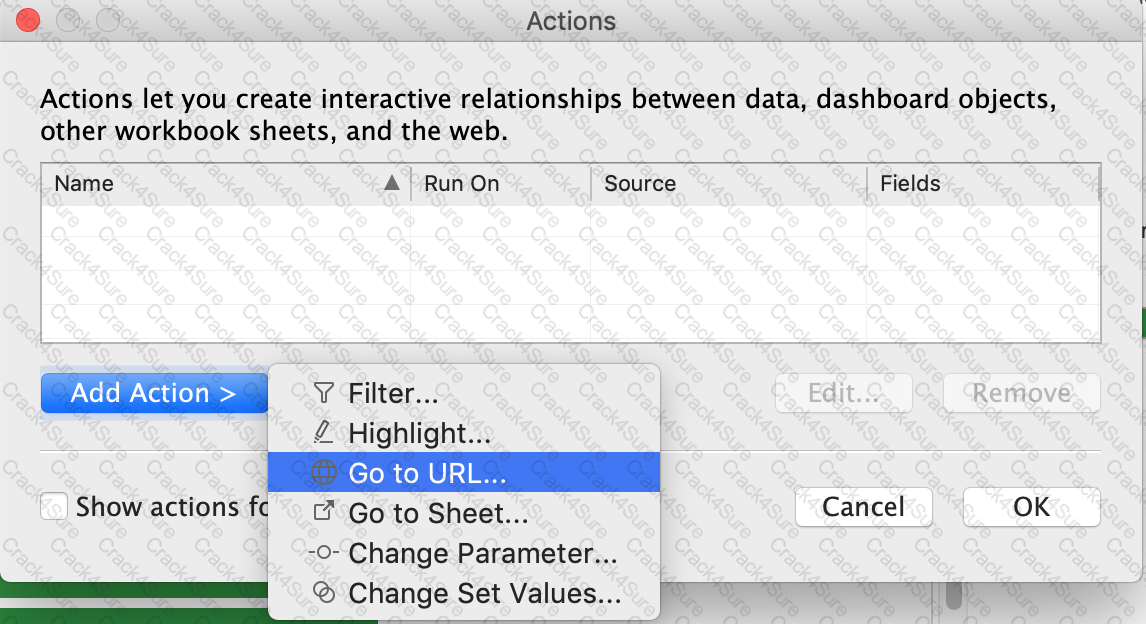
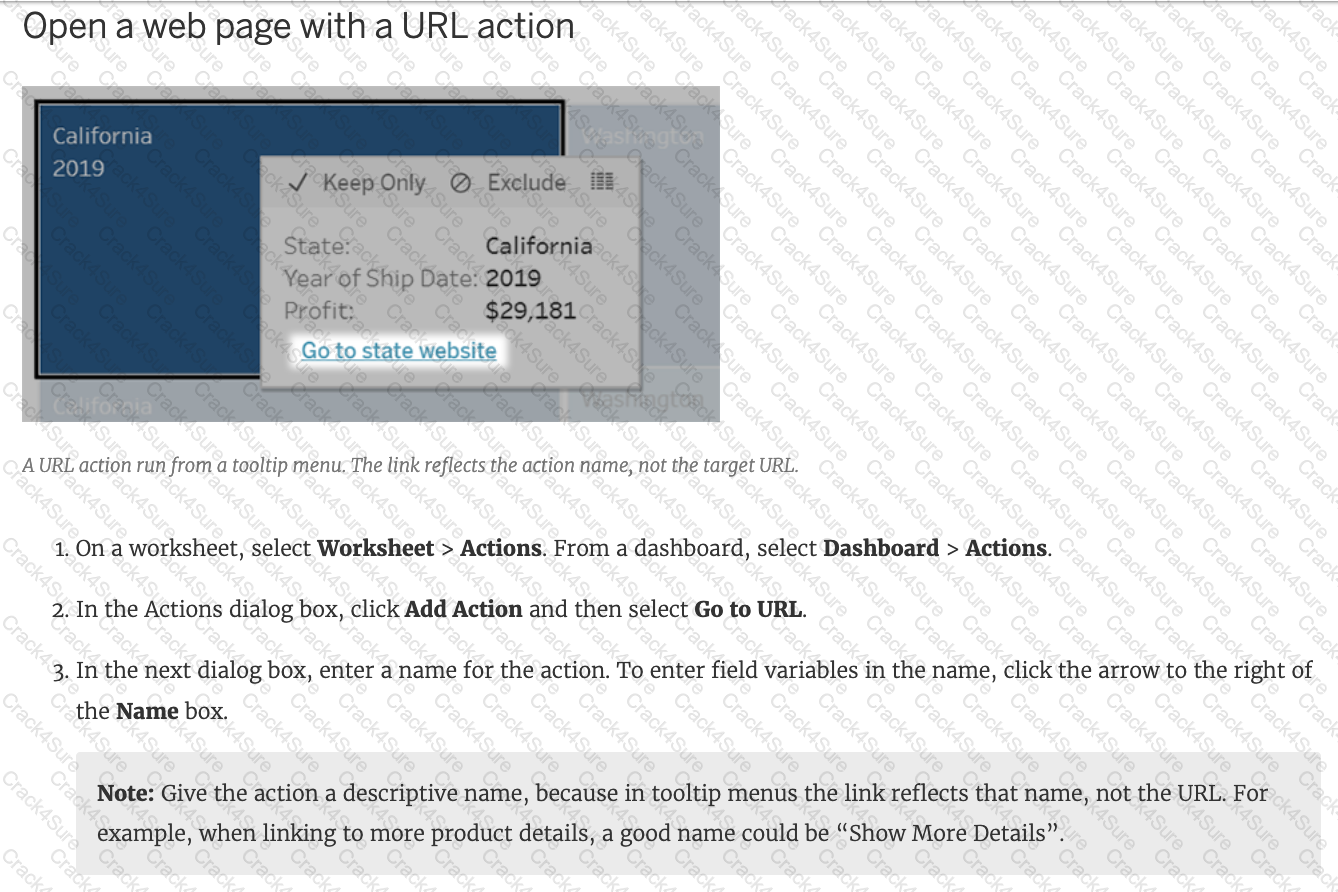
You have a dashboard that shows car rental statistics by city, including a field named Car Dropoff City in the view. A URL action in the dashboard uses https://en.wikipedia.org/wiki/
When you click Salt Lake City in the view, to where will the URL action direct you?
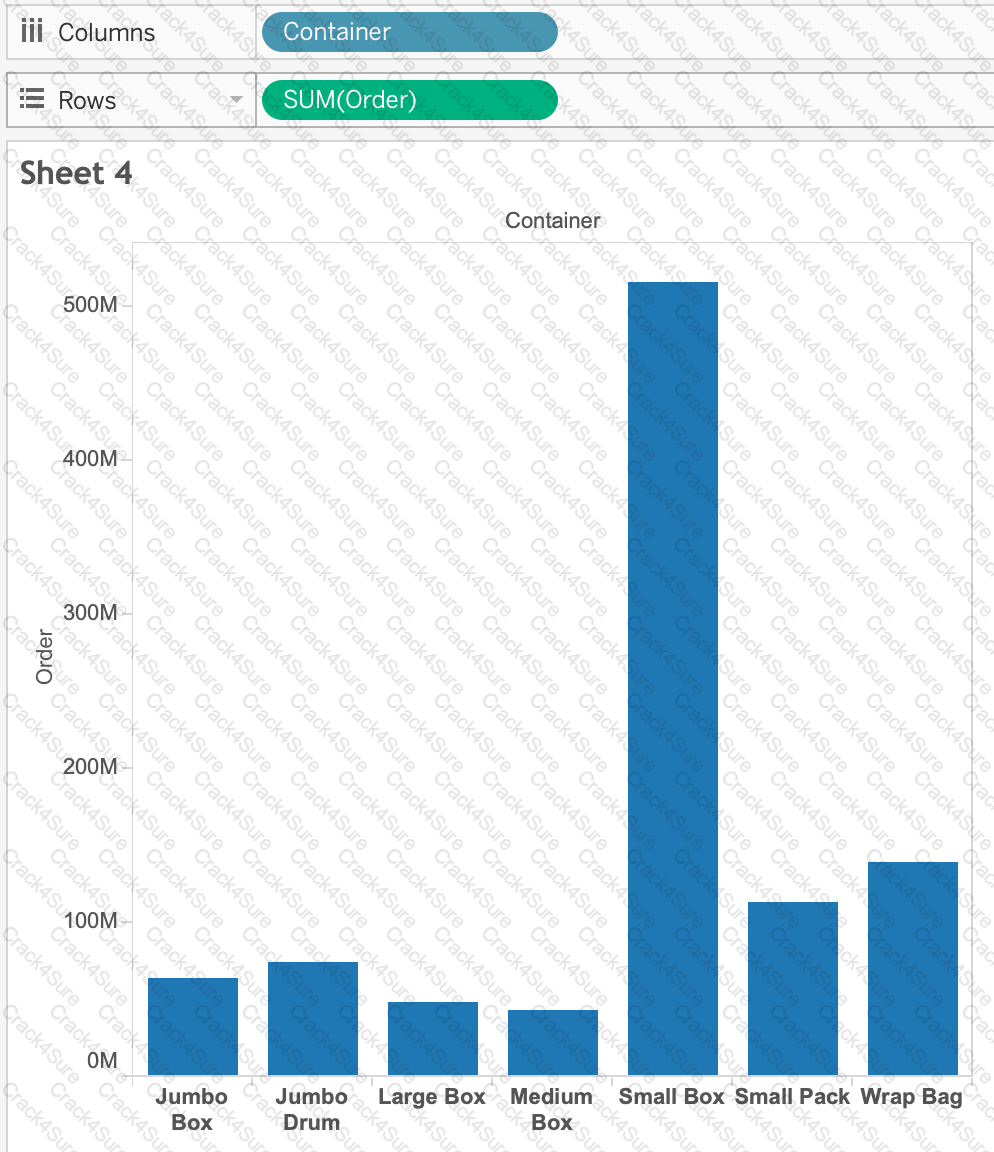
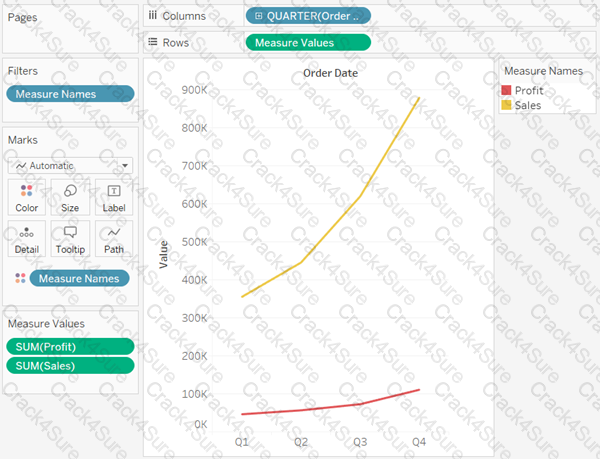
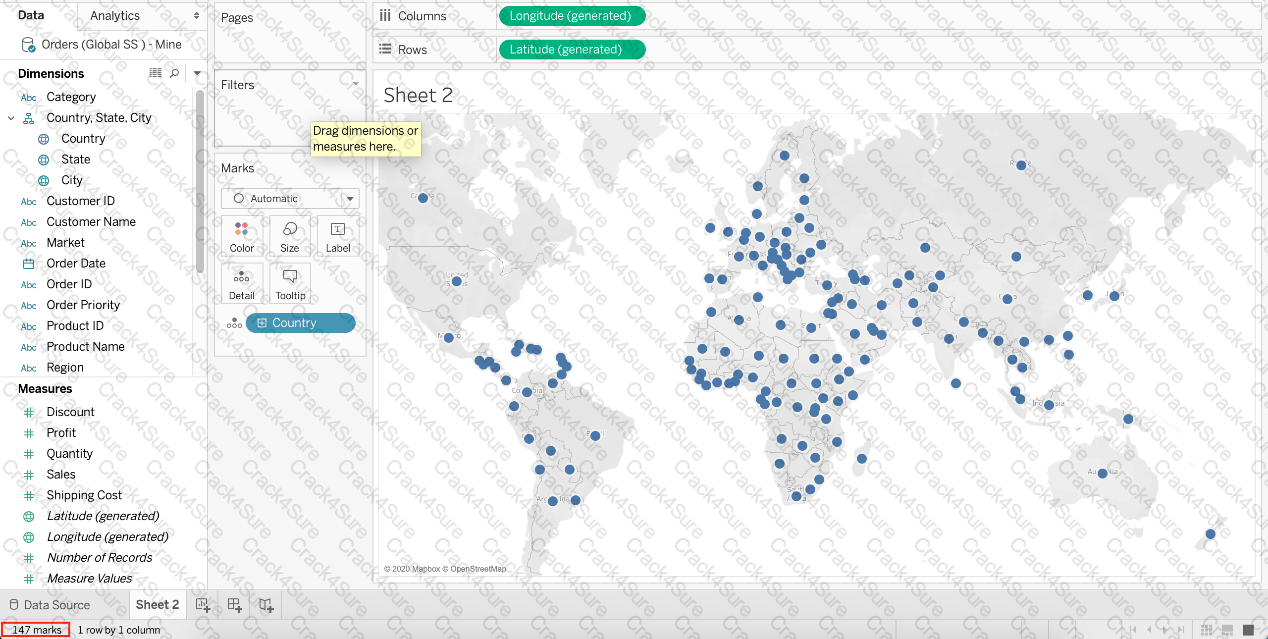
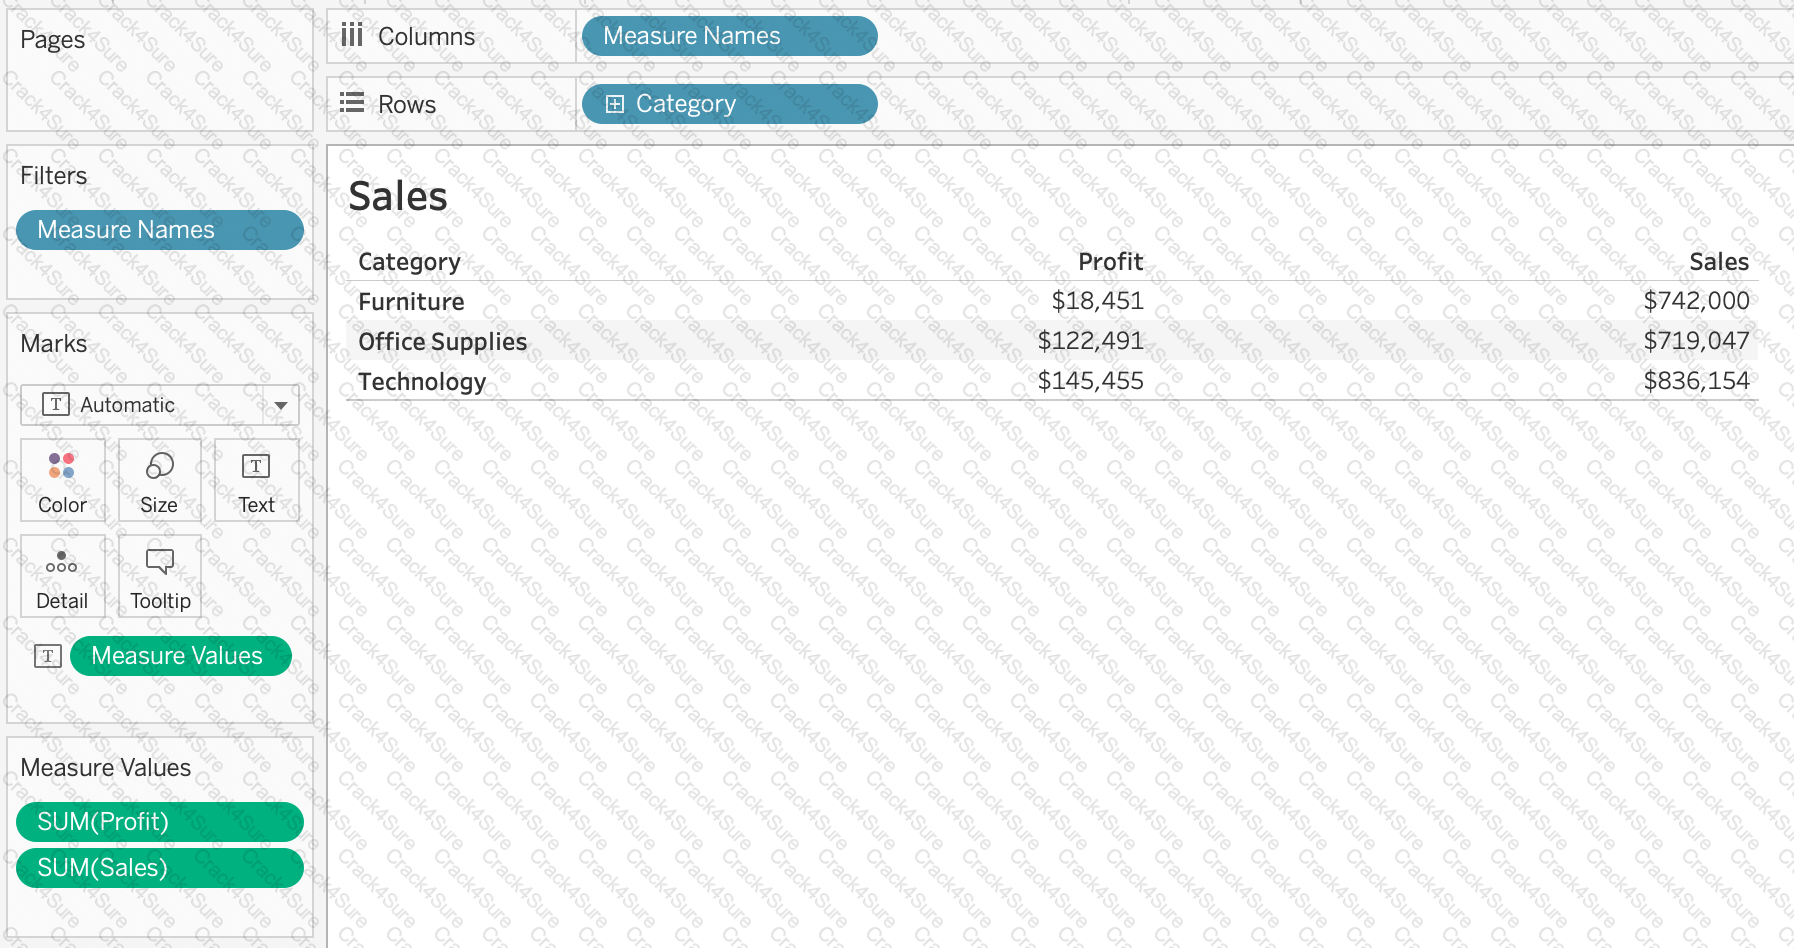
Suppose I have the following view. What will be the total number of marks if I drag a new measure to the row shelf vs the column shelf?
Which of the following is an example of a Date Part?
Which of the following URL prefixes are permitted when creating a URL Action in Tableau?
Which of the following is true about 'Incremental refresh' when creating Extracts in Tableau?
What does the following icon do in Tableau?
Larger image
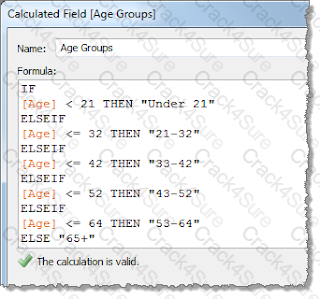
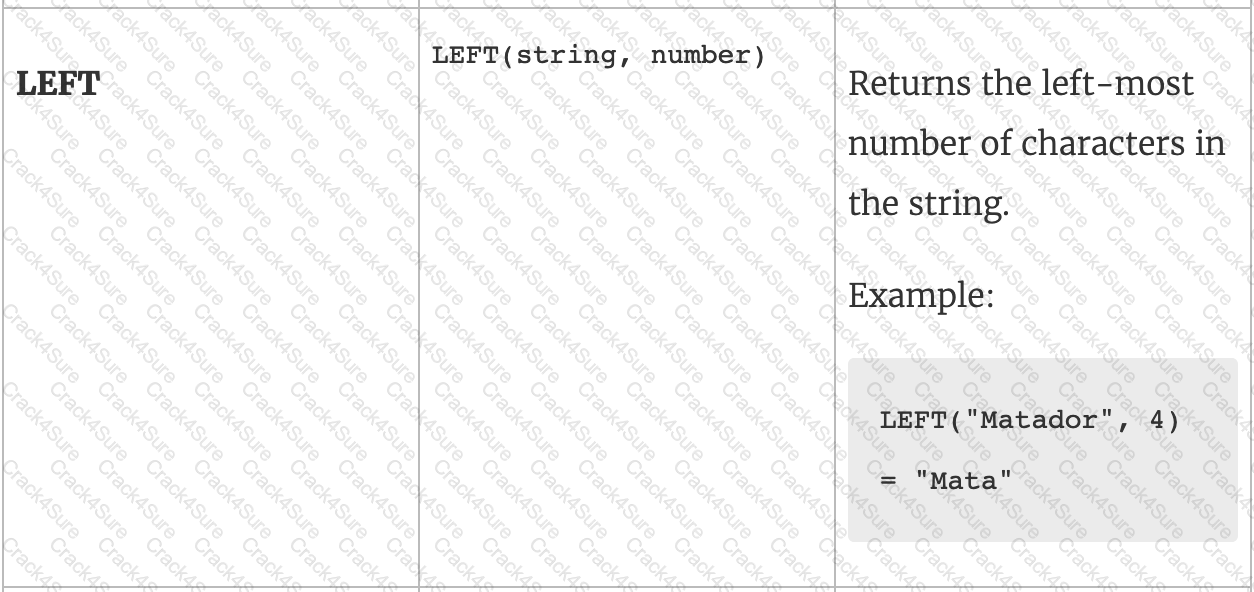
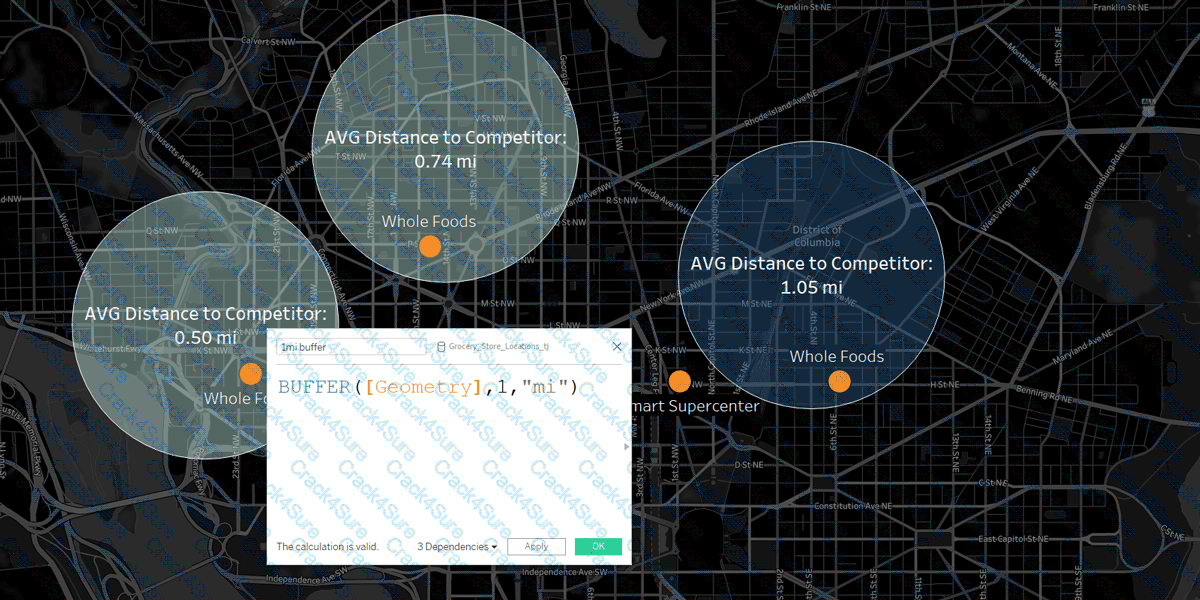
What will the following function return?
LEFT("Tableau", 3)
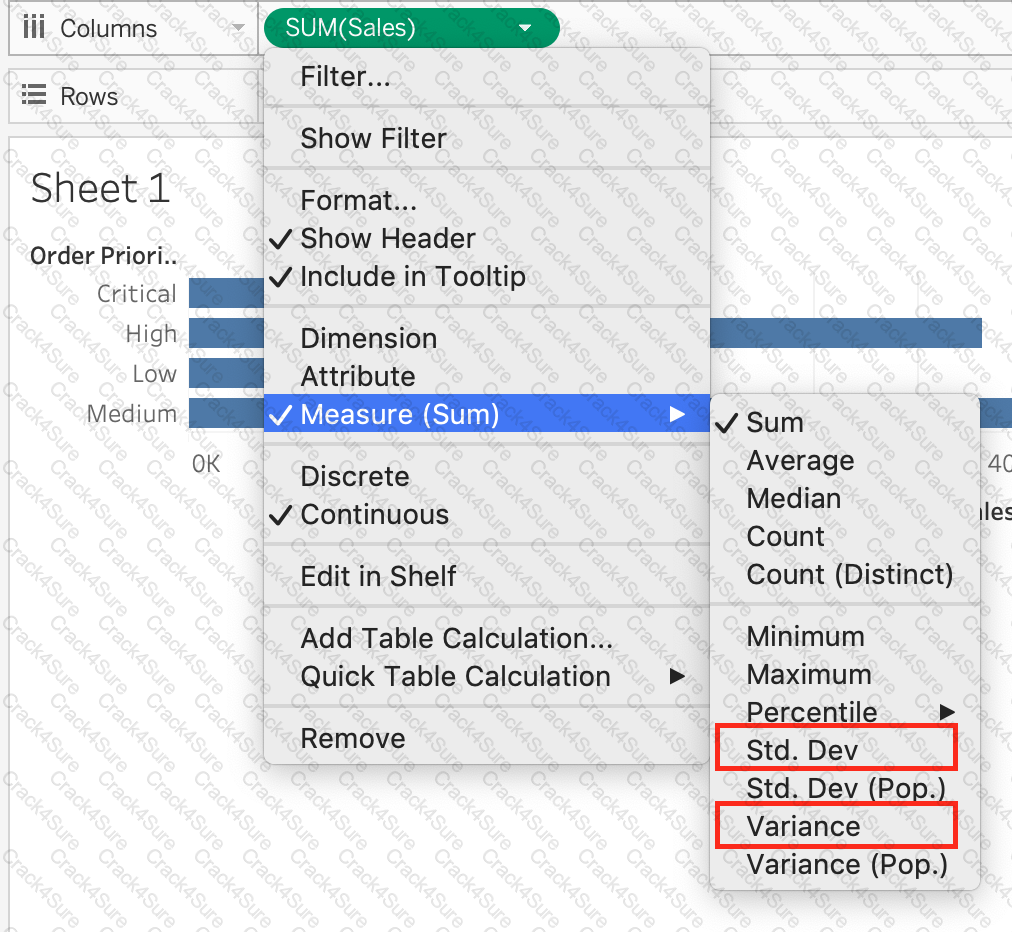
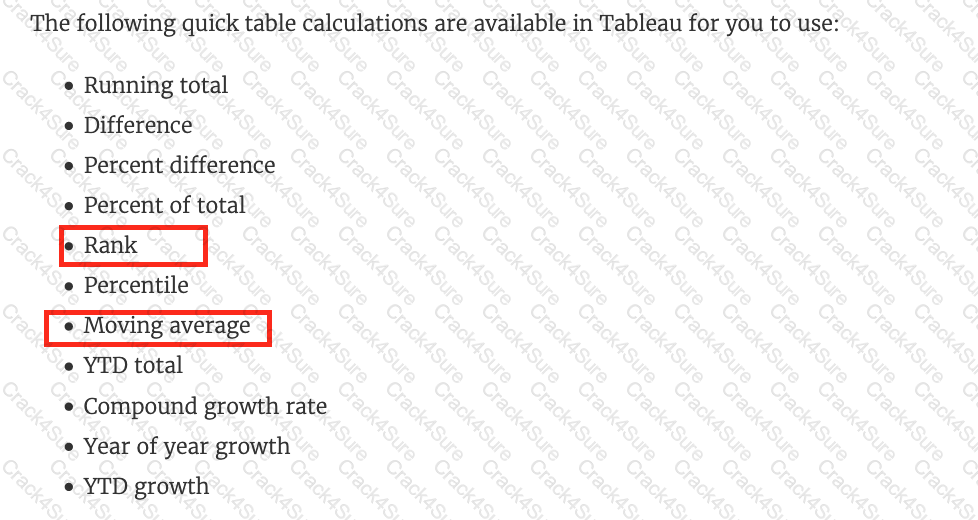
Which of the following calculations DO NOT need a quick table calculation?
You are creating a combined axis chart.
Where should you drag the second measure after dragging the first measure to the Rows shelf?
Which of the following is a compelling reason to export a sheet in Tableau to a PDF?
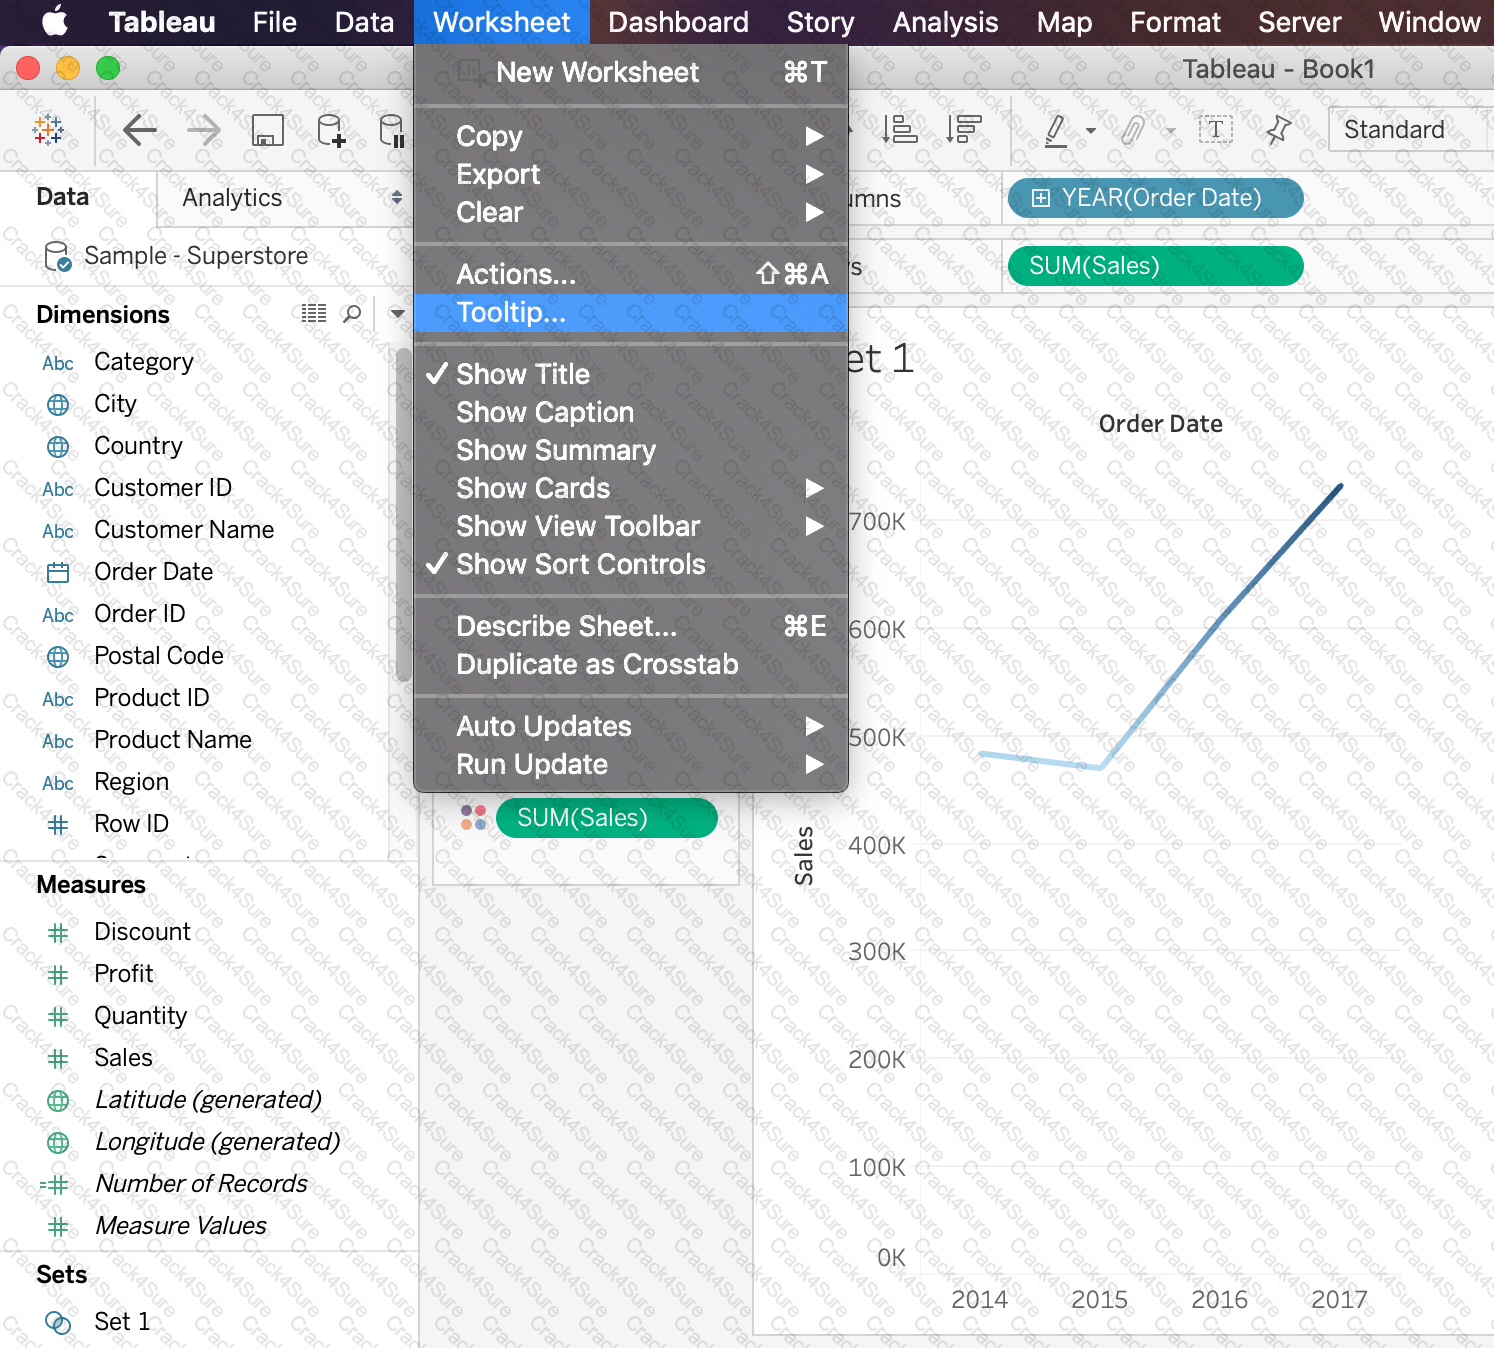
Which of the following are valid ways to Bold the Tooltip content in Tableau?
Tableau auto-generates ____________ dimension(s) and _____________ measure(s) for us
True or False: It is not possible to blend axes for multiple measures into a single axis
What is a Tableau story point?
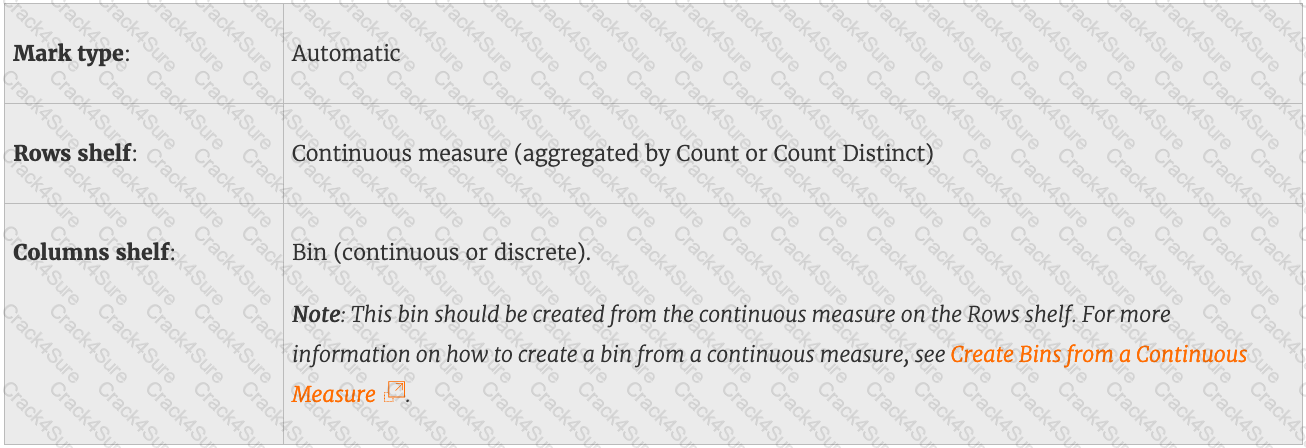
The option to create bins is available for which type of field?
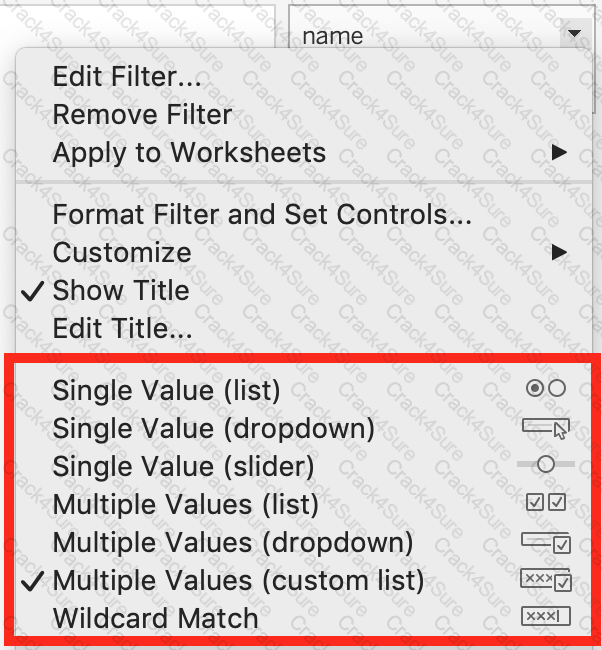
Which of these is NOT a type of Quick Filter available in Tableau?
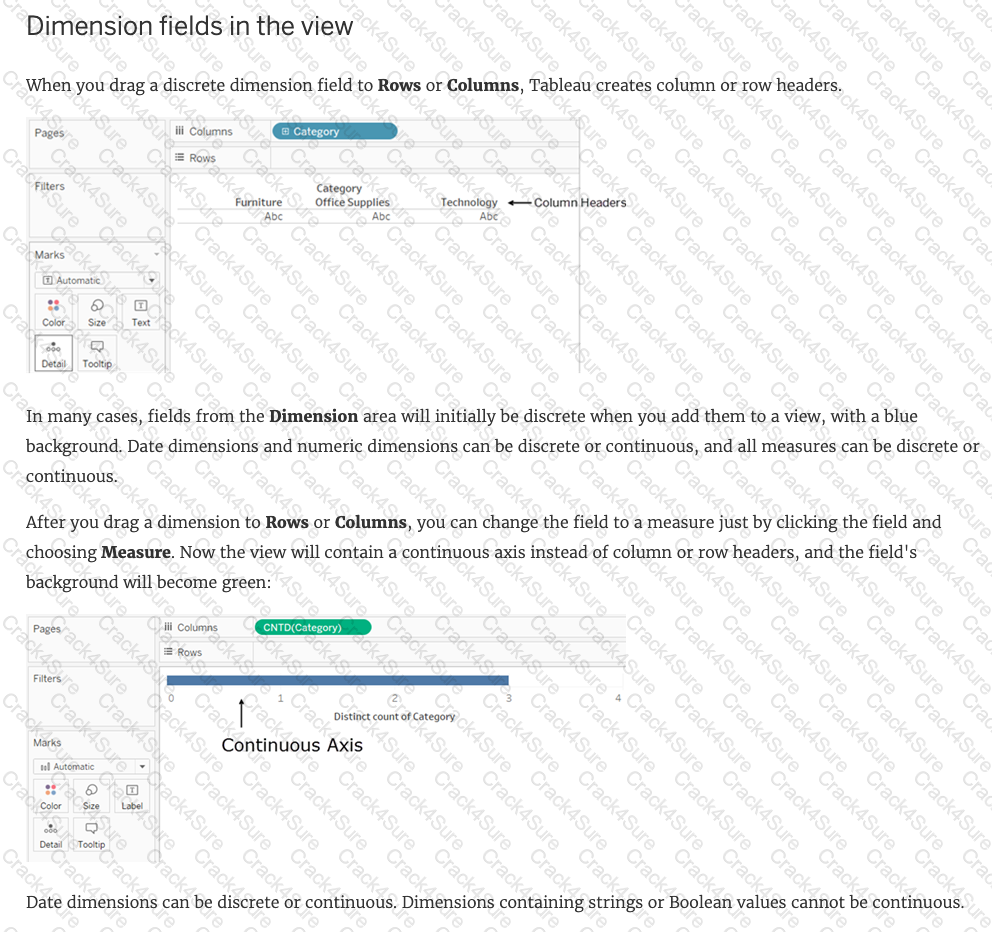
Which of the following are true about dimensions?
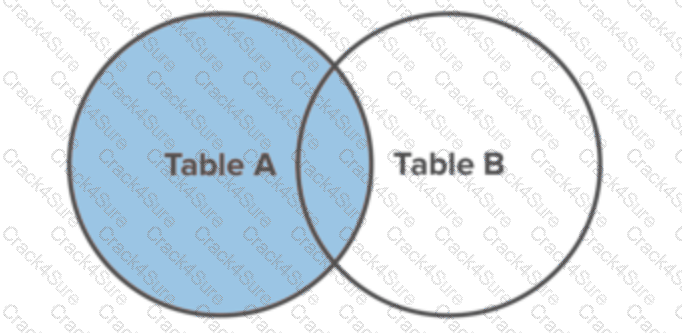
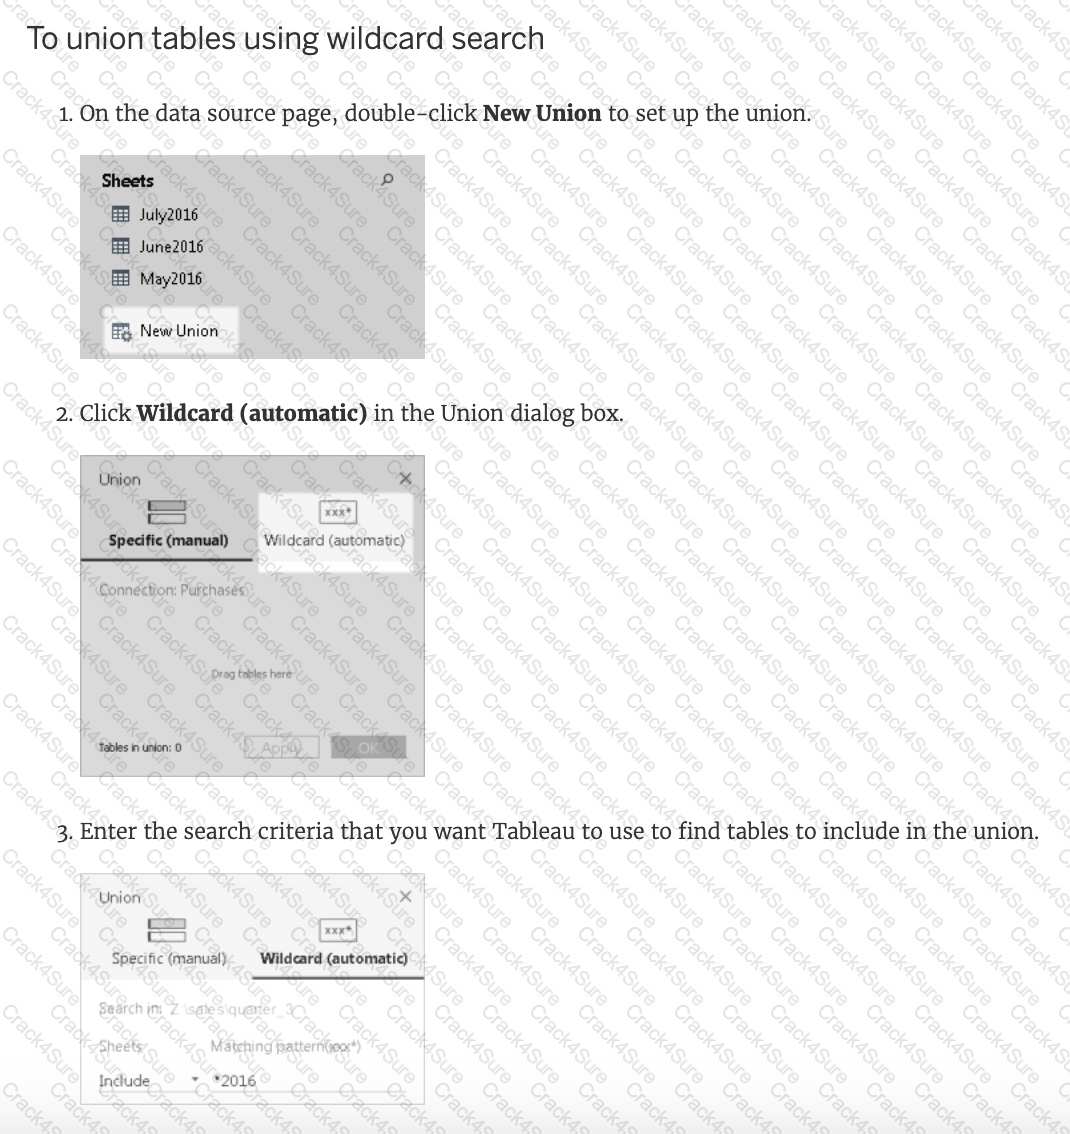
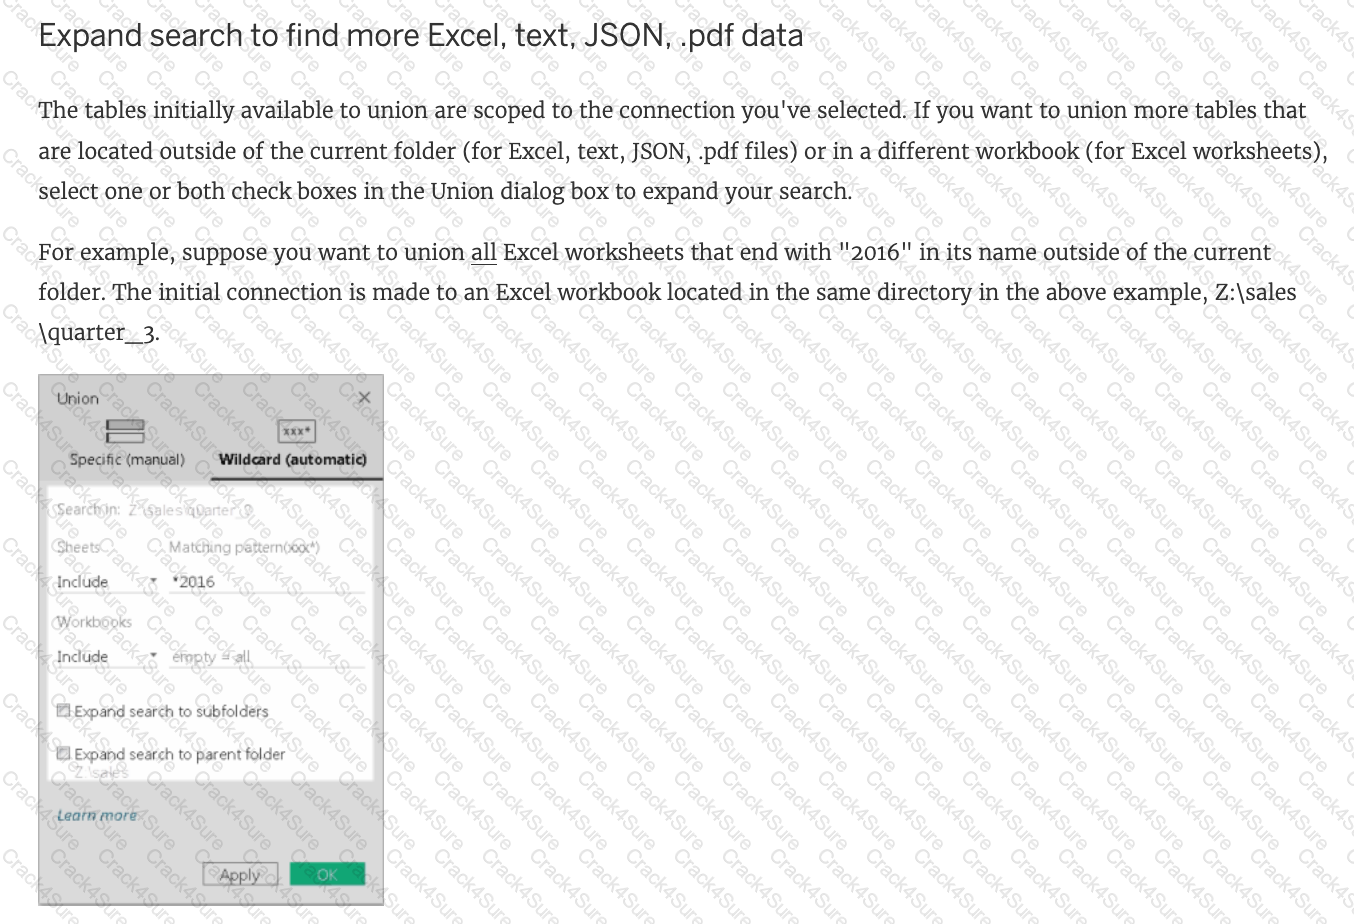
Which of the following situations describe the best reason to use a union?
Which of the following is NOT a new feature introduced in Tableau 2020.1?
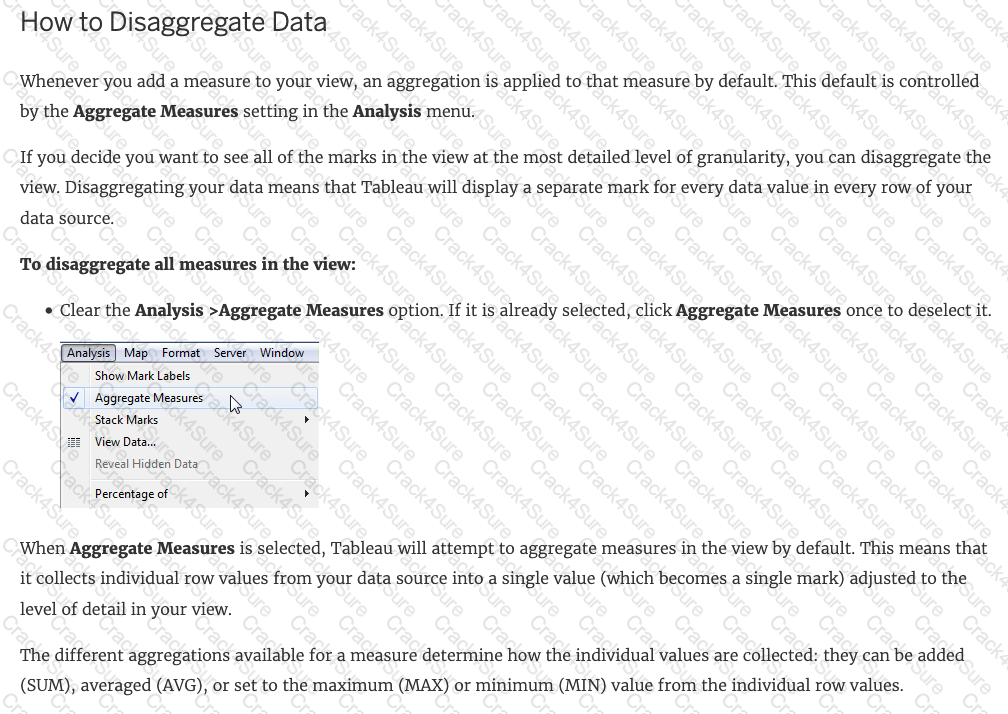
If you decide you want to see all of the marks in the view at the most detailed level of granularity, you can __________________ the view.
Which of the following are valid ways to make the font more readable in Tableau?
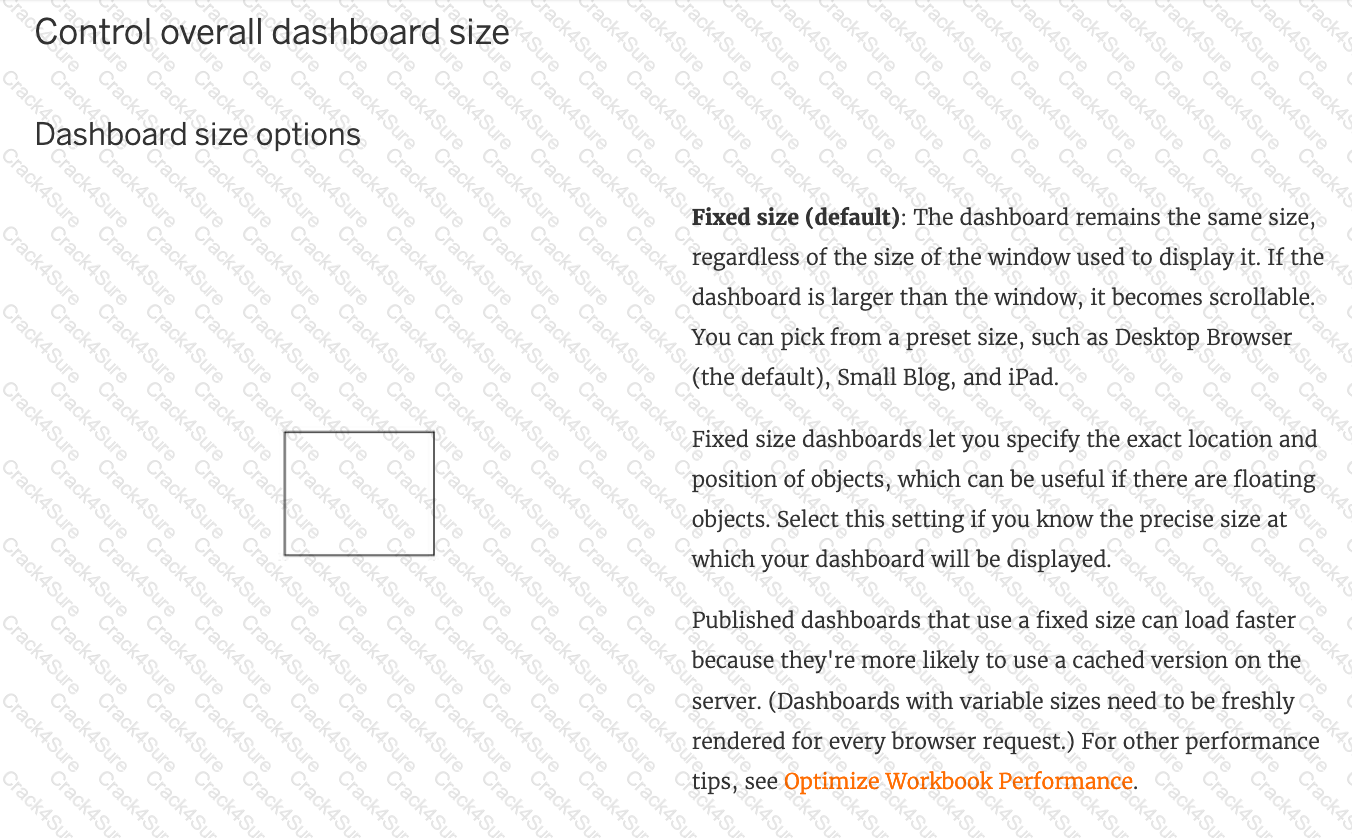
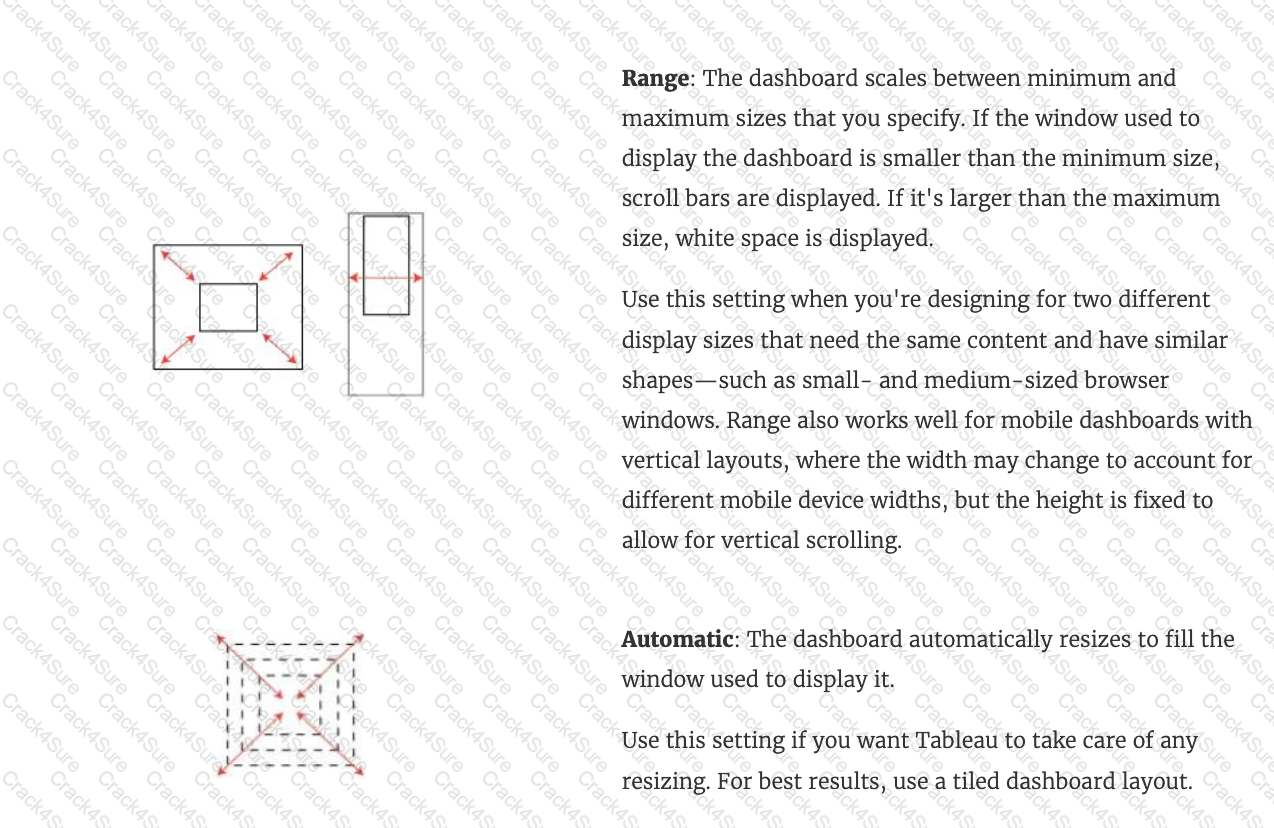
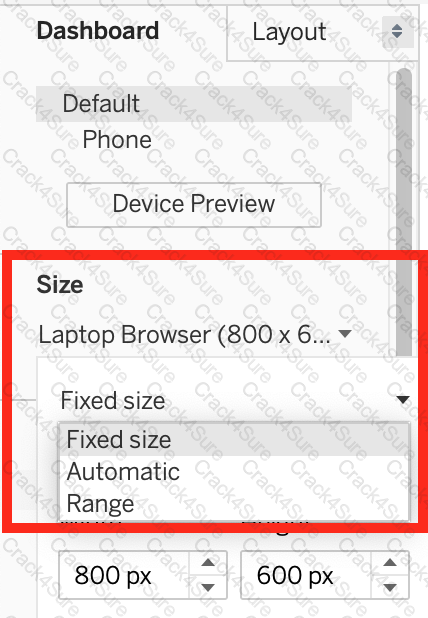
Which of the following are valid Dashboard size options?
DOWNLOAD THE DATASET FROM - https://drive.google.com/file/d/1F8L_Rl5B9LAz8RDi-DdjWx3Iv-SgzaBq/view?usp=sharing ( if you haven 't already from the test instructions page! )
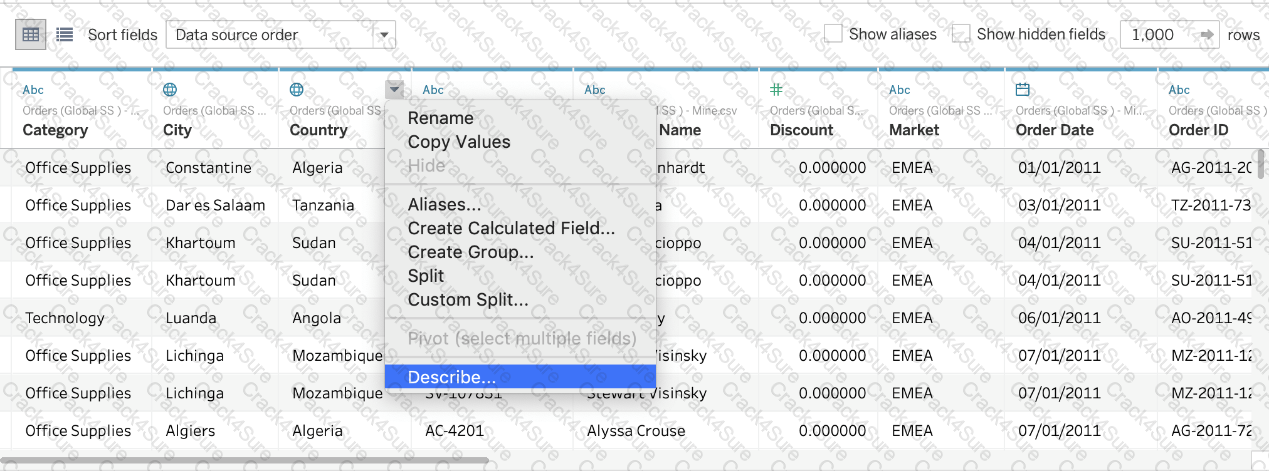
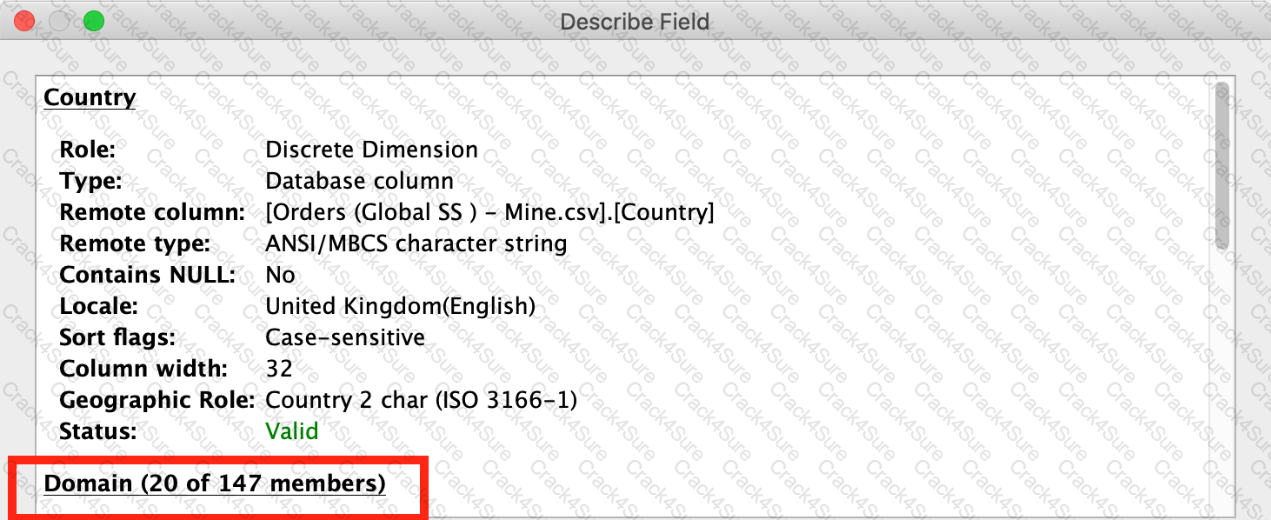
How many different countries are present in the dataset?
Which of the following can you use to create a Histogram?
A _____________ action is a hyperlink that points to a web page, file, or other web-based resource outside of Tableau.
What are two use cases for creating hierarchies from the Data pane? Choose two.
Which mark type is used in a highlight table?
Which statement accurately describes an extract when the Physical Tables option is selected?
What are three geographic roles that you can assign to a field? Choose three.
Which chart type uses automatically generated sizes that cannot be resized by using the Marks card?
How can you MANUALLY assign geographic roles to a dimension from the data pane?
With the Marks card drop-down menu set to Automatic, a line chart will be created whenever you place what on the Rows shelf and the Columns shelf?
To customize links based on the data in your dashboard, you can automatically enter field values as _______________ in URLs
_________________ are a local copy of a subset or entire data set that you can use to share data with others, when you need to work offline, and improve performance.
If you are working with a huge dataset, which of the following are strong reasons to use a context filter?
What are three ways to access bolding options for the text in a tooltip? Choose three.
To display data that has both negative and positive quantitative values, Tableau Desktop will display marks by using__________________as the default.
In which of the following scenarios would having a live connection be more beneficial than using an extract?
You view the relationship canvas shown in the following exhibit.
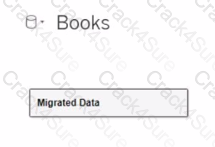
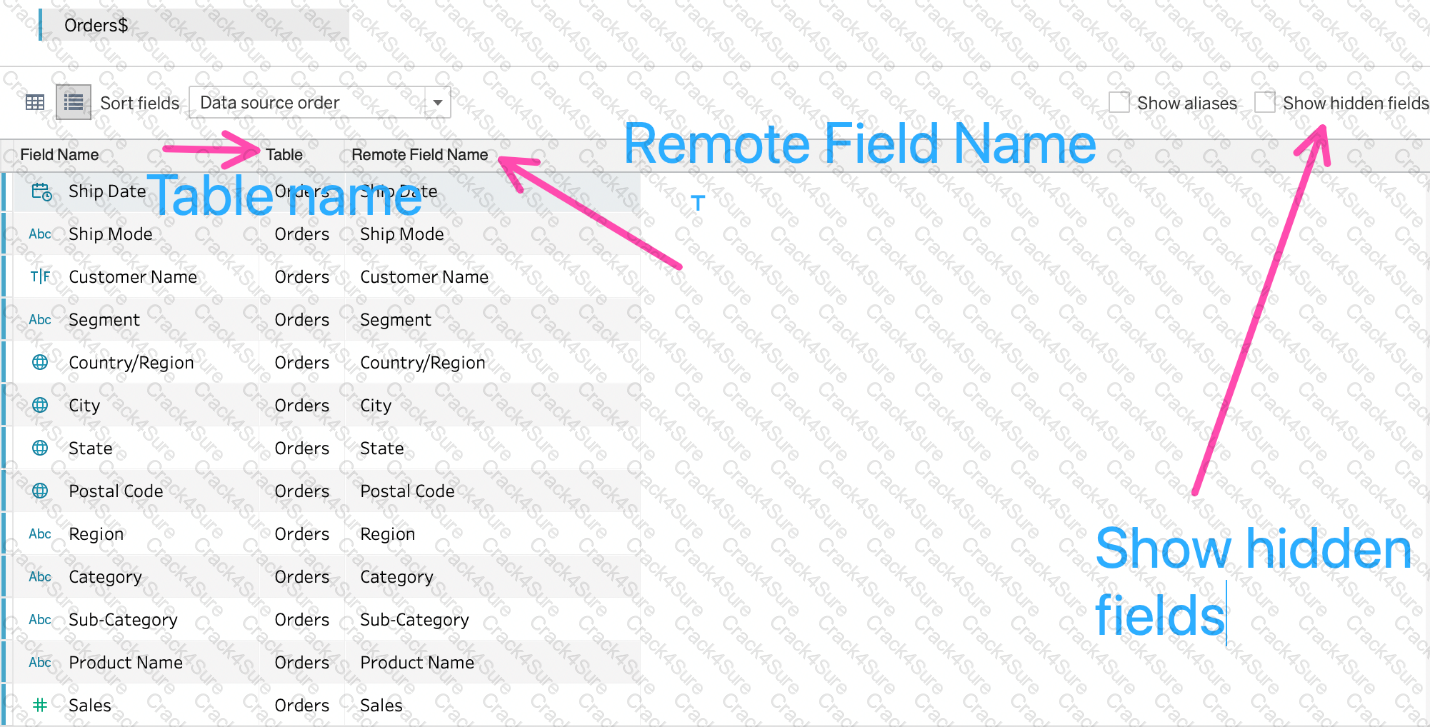
What does Migrated Data indicate?
Which of the following are correct ways to define a join in Tableau version 2020.3 and above?
Which of the following is a benefit of using a Tableau Data Source (.tds)?
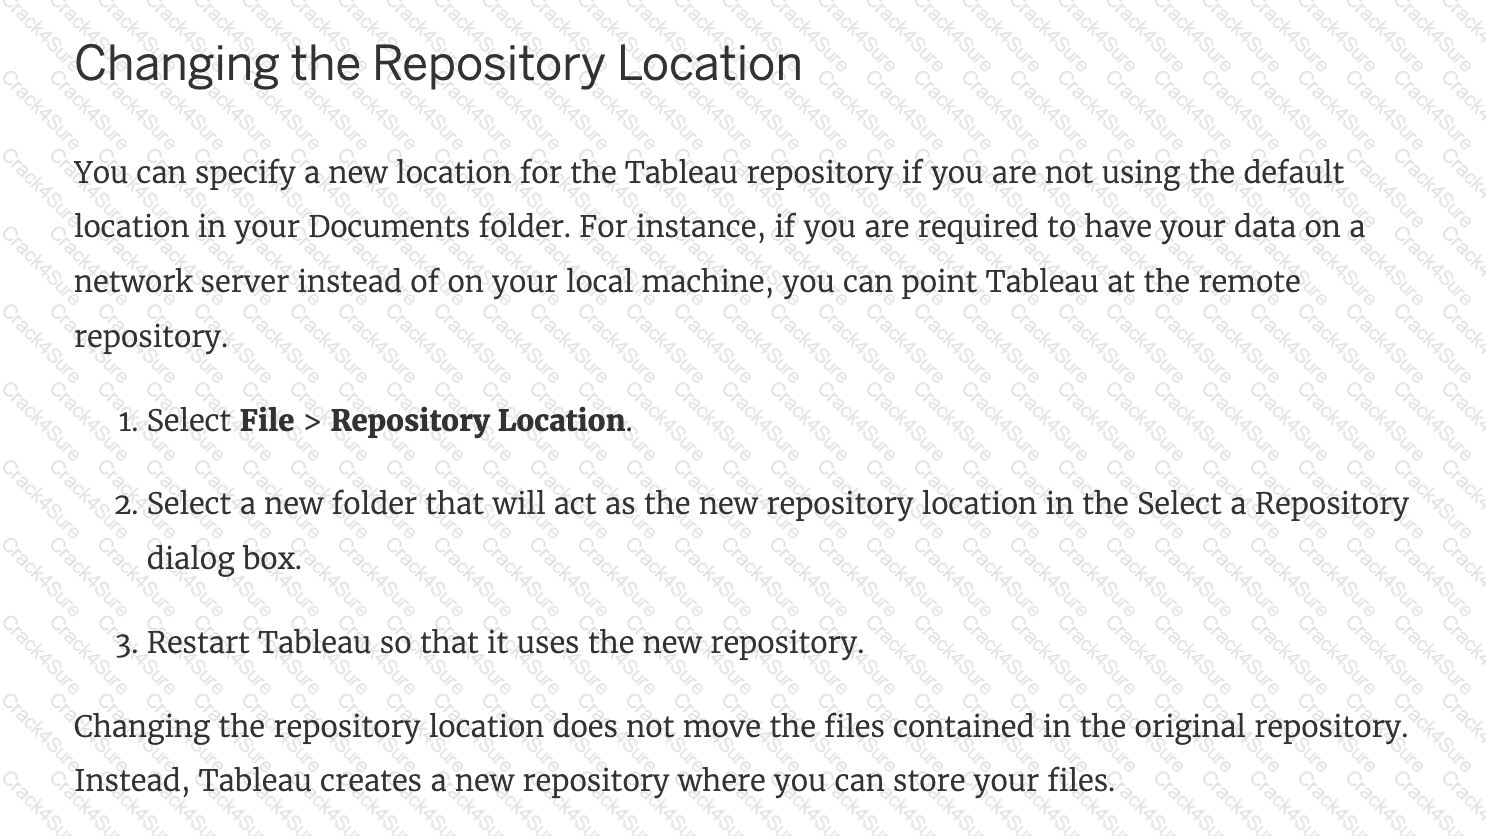
How can you change the default Tableau repository location?
Which two functionalities can you provide to consumers by adding a parameter to a visualization? Choose two.
From which three locations can you sort a visualization? Choose three.
While borders and background colors let you visually highlight items on a dashboard, _________ lets you precisely space items.
The calculation [Ship Date] - [Order Date] will return _______________
Which two analytics options are available for a scatter plot view? Choose two.
Which two filter modes can you use with continuous filters? Choose two.
Which of the following are valid ways to export a dashboard with multiple visualisations as an image?
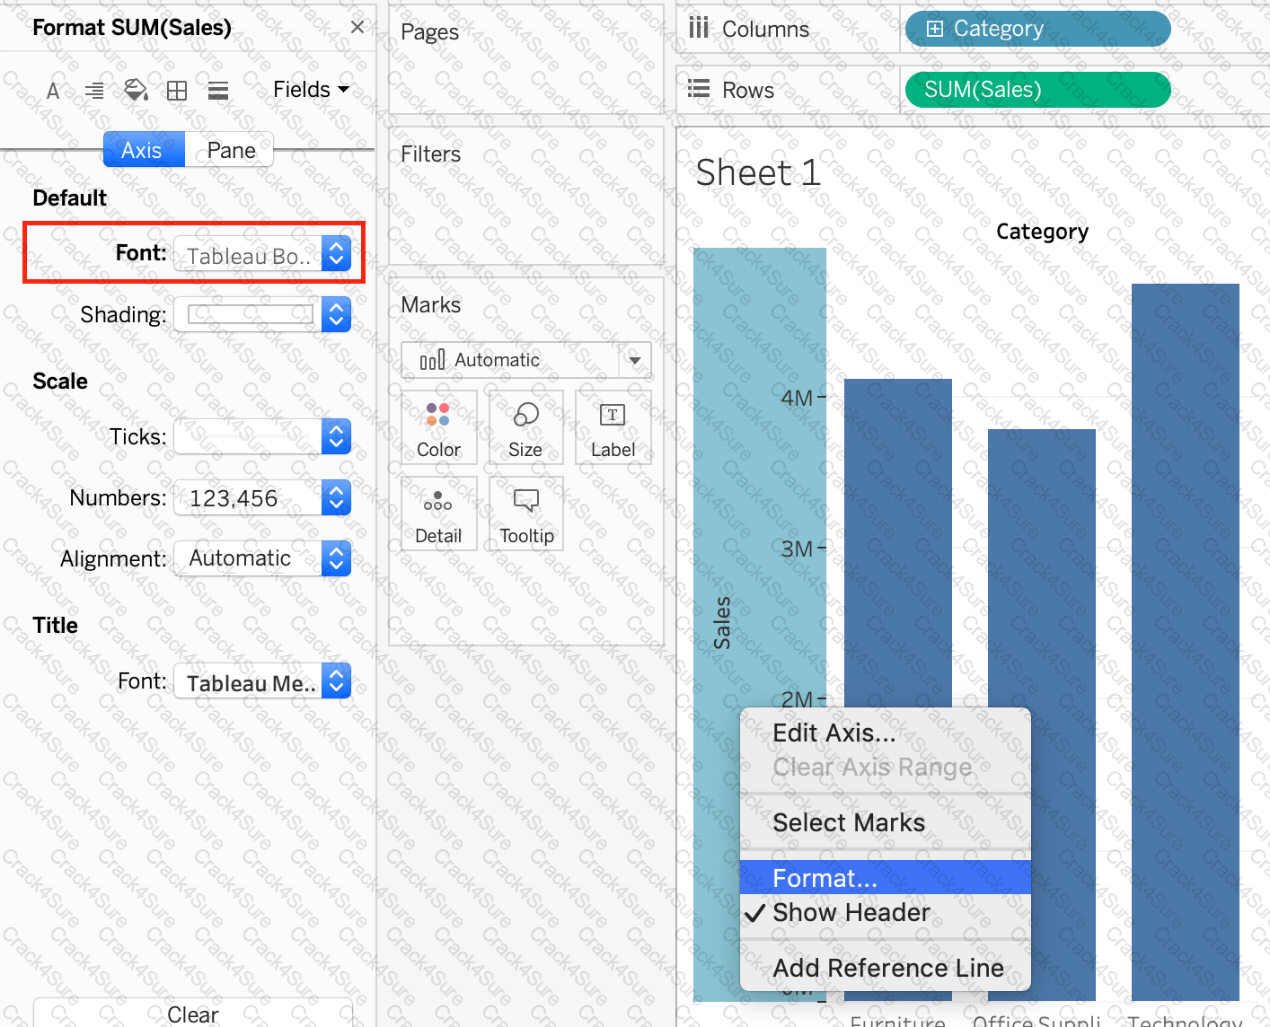
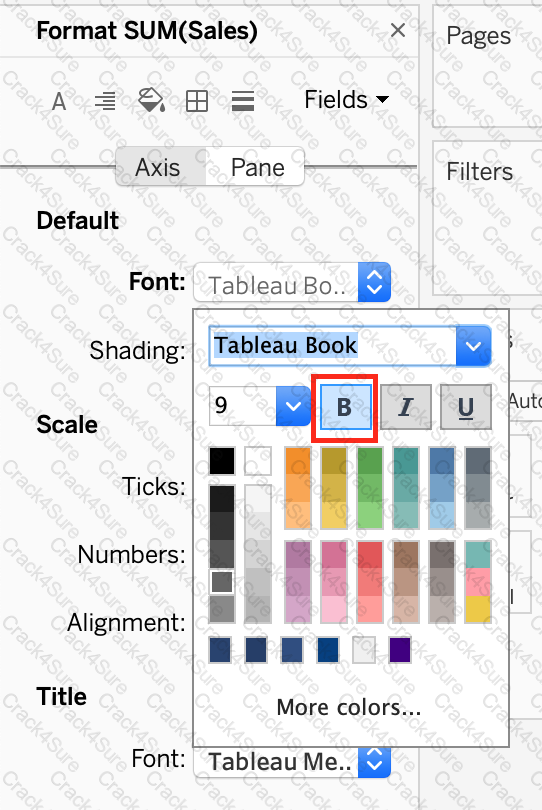
How can you format an axis as Bold in Tableau?
Which type of chart can you create without using a dimension?
Which one of the following is a dimension?
The icon associated with the field that has been grouped is a ______________
Which of the following can you add a reference line to?
Which of the following are valid use-cases for the 'Manage Metadata' functionality?
What are two examples of a date value?
Choose two.
Which type of filter affects a fixed Level of Detail (LOD) expression?
Which statement accurately describes aliases?
How can you set the default properties of a field to Currency?
When field names in the Union do not match, then:
When is an axis created for the visualisation in Tableau?
You create a visualization by first adding a measure to rows. Next, you add a dimension wilh 11 members to columns.
Assuming that all the dimensions have a non-zero value, how many marks are in the view before and after the dimension is added?
You have a workbook that contains one data source and you need to combine data from another database. What should you do first?
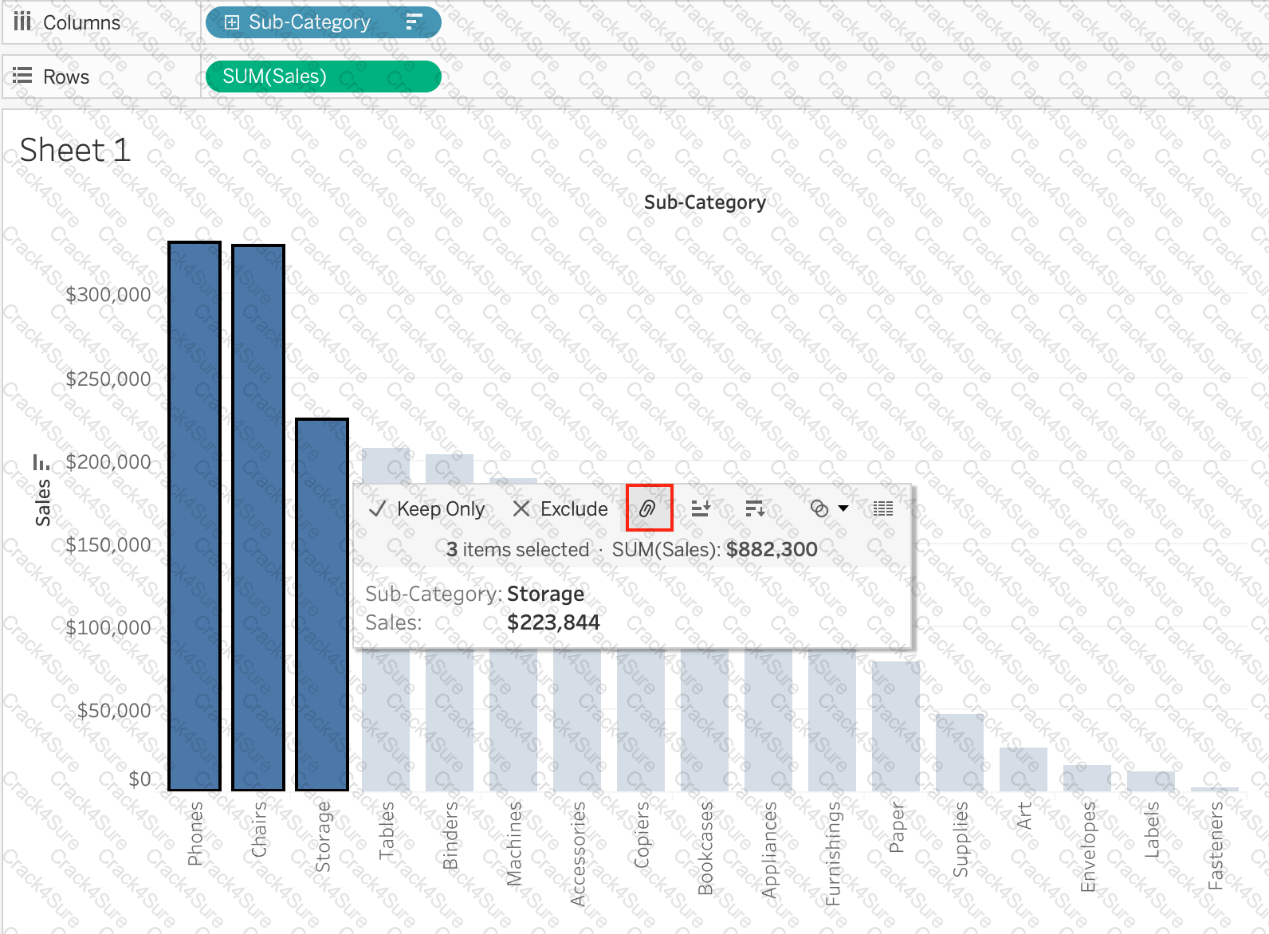
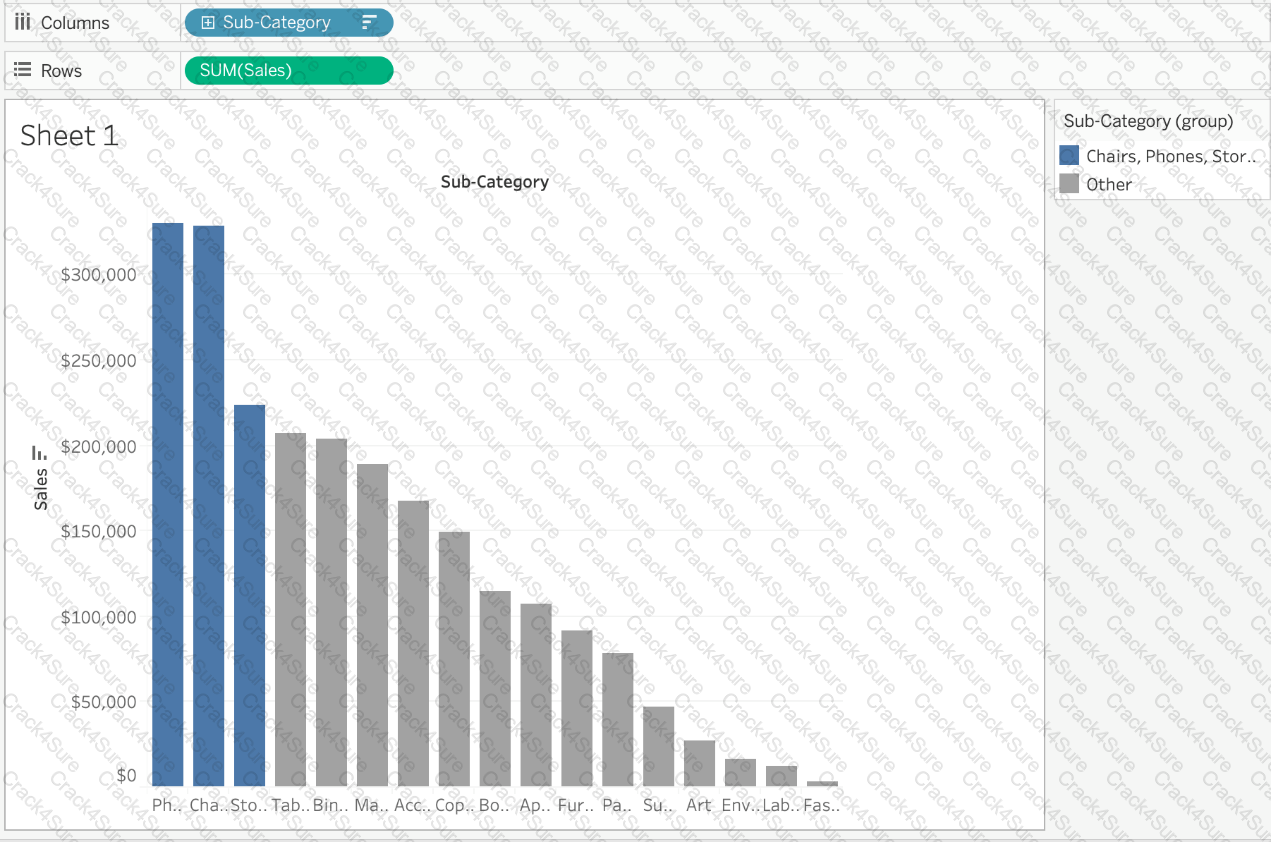
You create a crosstab that shows a list of 100 hotel chains alongside their average nightly cost. You also create two groups showing, respectively, the top 10 and bottom 10 hotel chains by cost, with subtotals.
What should you do to improve the crosstab and compare the two groups to all the remaining hotel chains?
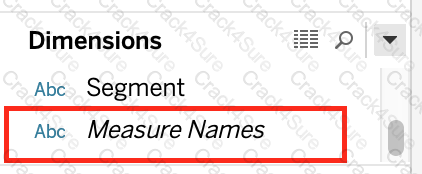
Which of the following are True for Measure Names?
Which two actions can you perform when you join tables from multiple connections? Choose two.
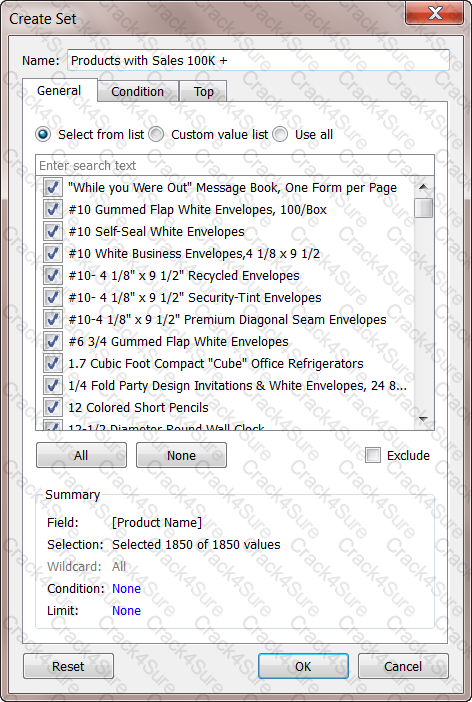
Which of the following is a valid way to create Sets in Tableau?
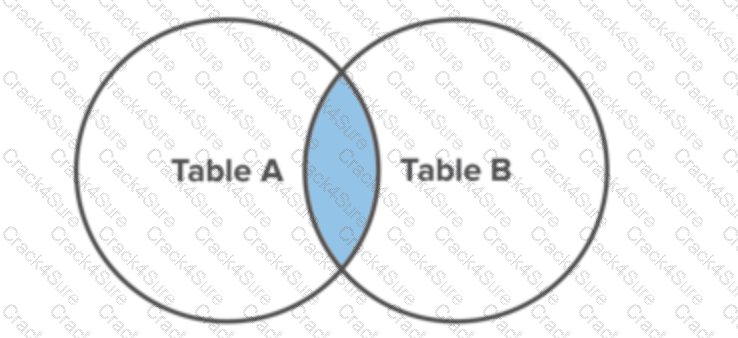
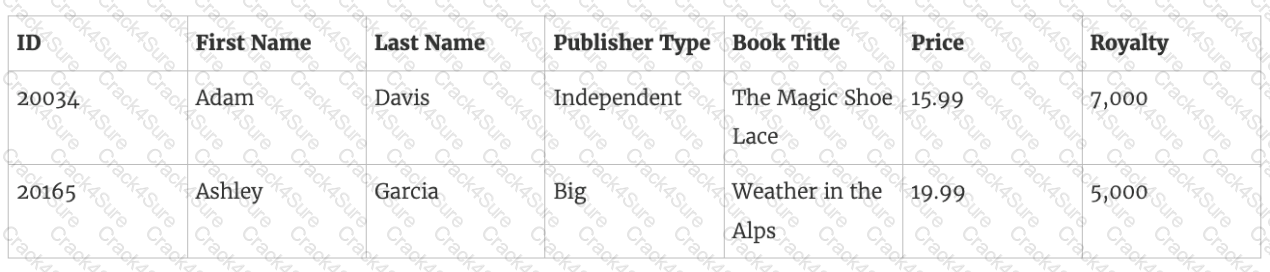
Which statement accurately describes a join?
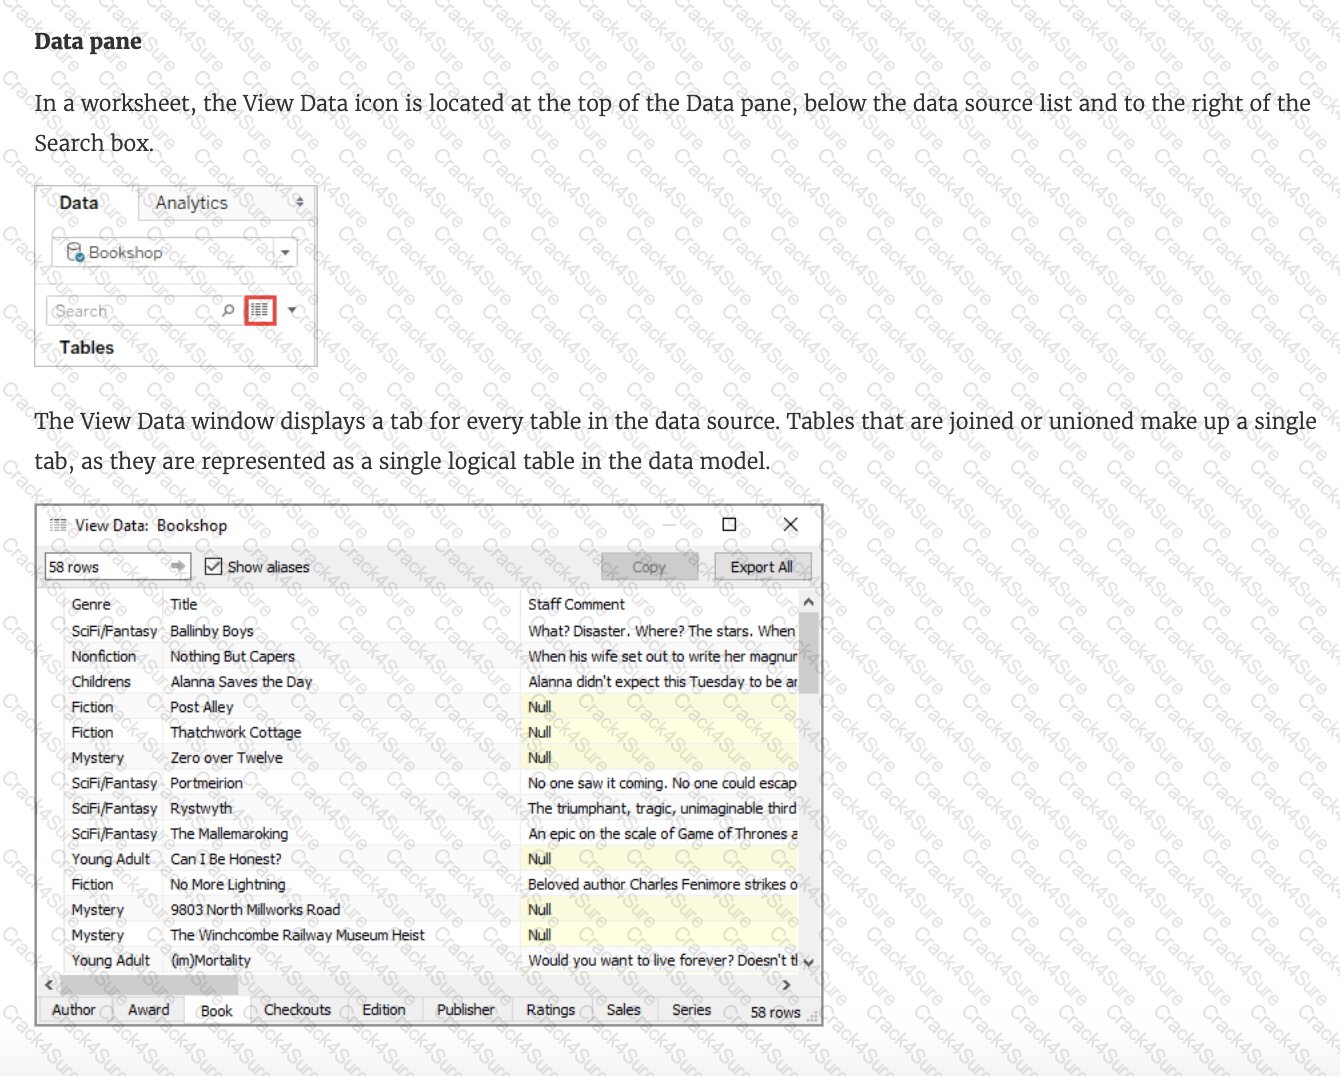
The View Data window displays as much of the data as possible by default, up to _______________ rows.
_____________ is a snapshot of the data that Tableau stores locally. Good for very large datasets of which we only need few fields.
You have cleaned a data source properly, created some calculated fields and renamed some columns. You want to save these changes for future use cases. Which of the following would BEST satisfy this requirement?
You have a bar chart that has a dimension on the Columns shelf and a measure on the Rows shelf.
How can you make a stacked bar chart?
True or False: A LEFT JOIN or INNER JOIN creates a row each time the join criteria is satisfied, which can result in duplicate rows. One way to avoid this is to use data blending instead.
When working with Excel, text file data, JSON file, .pdf file data, you can use _________________ to union files across folders, and worksheets across workbooks. Search is scoped to the selected connection.
You want to save a view as an image that you can paste into a Microsoft Word document. Which two statements accurately describe exporting a view as an image? Choose two.
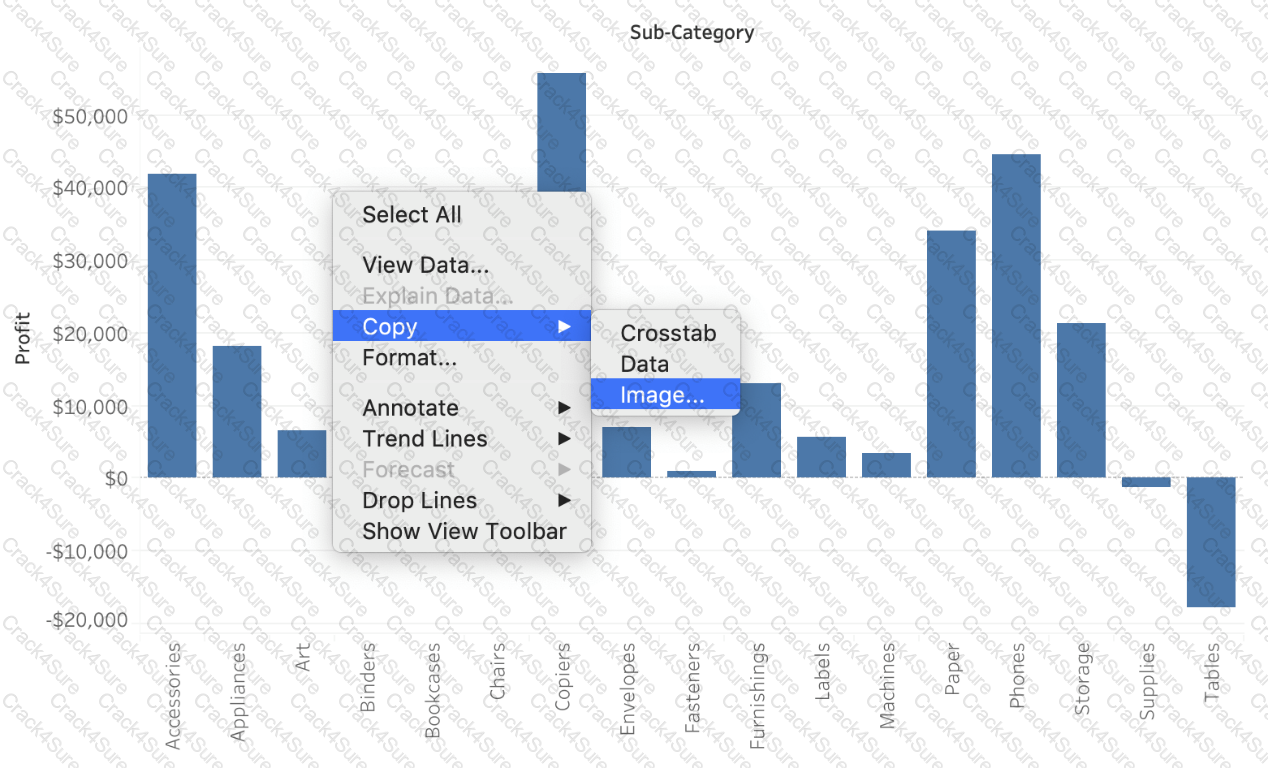
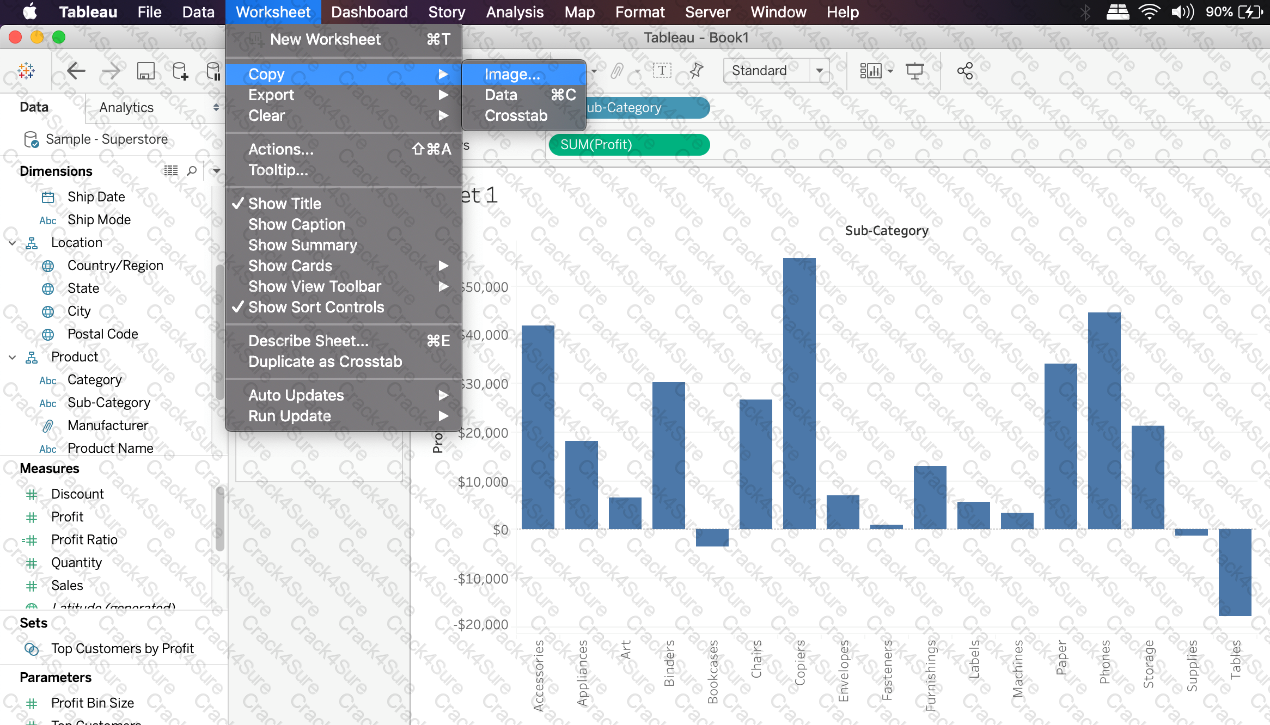
Which of the following are valid ways to copy a worksheet visualisation as an image?
3 Months Free Update
3 Months Free Update
3 Months Free Update

TESTED 09 Jul 2026
 Chart, bar chart
Description automatically generated
Chart, bar chart
Description automatically generated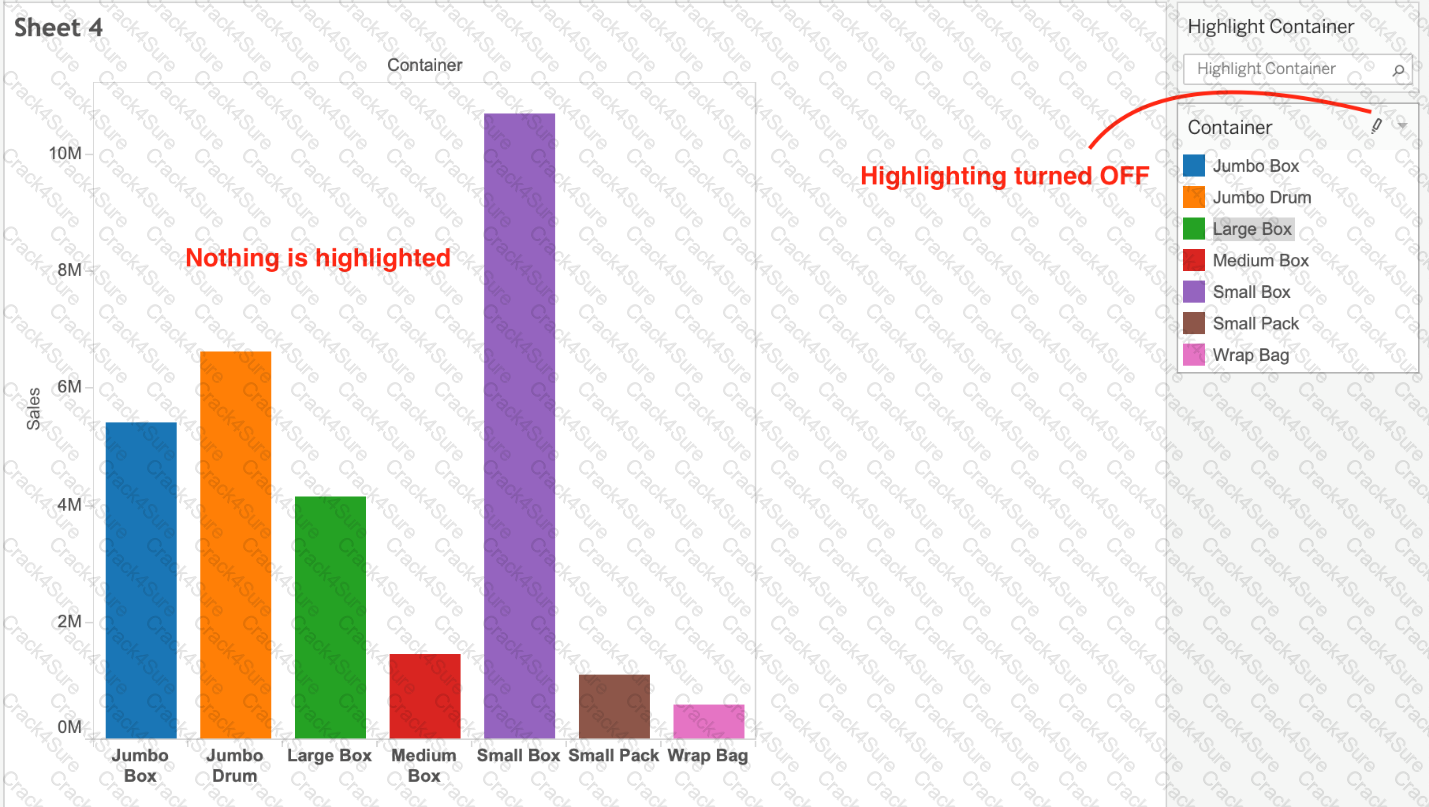 Chart, bar chart
Description automatically generated
Chart, bar chart
Description automatically generated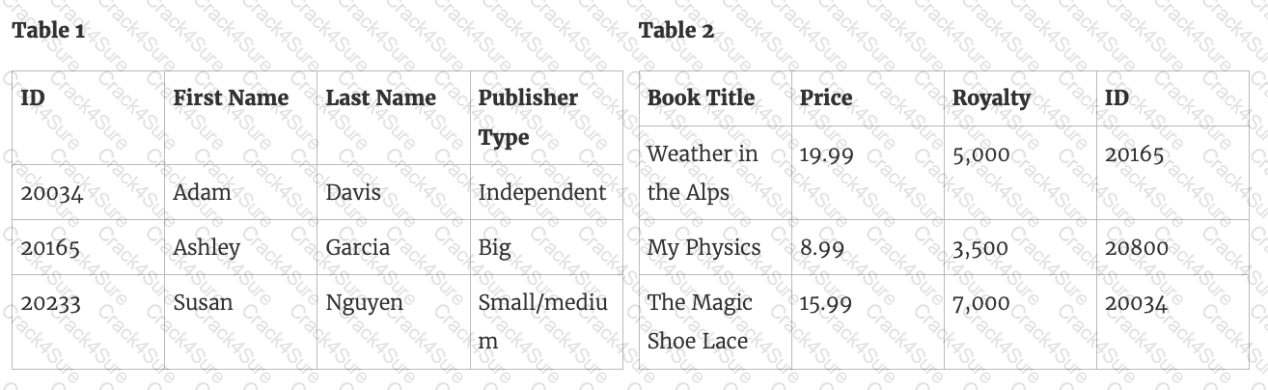

 Graphical user interface, application
Description automatically generated
Graphical user interface, application
Description automatically generated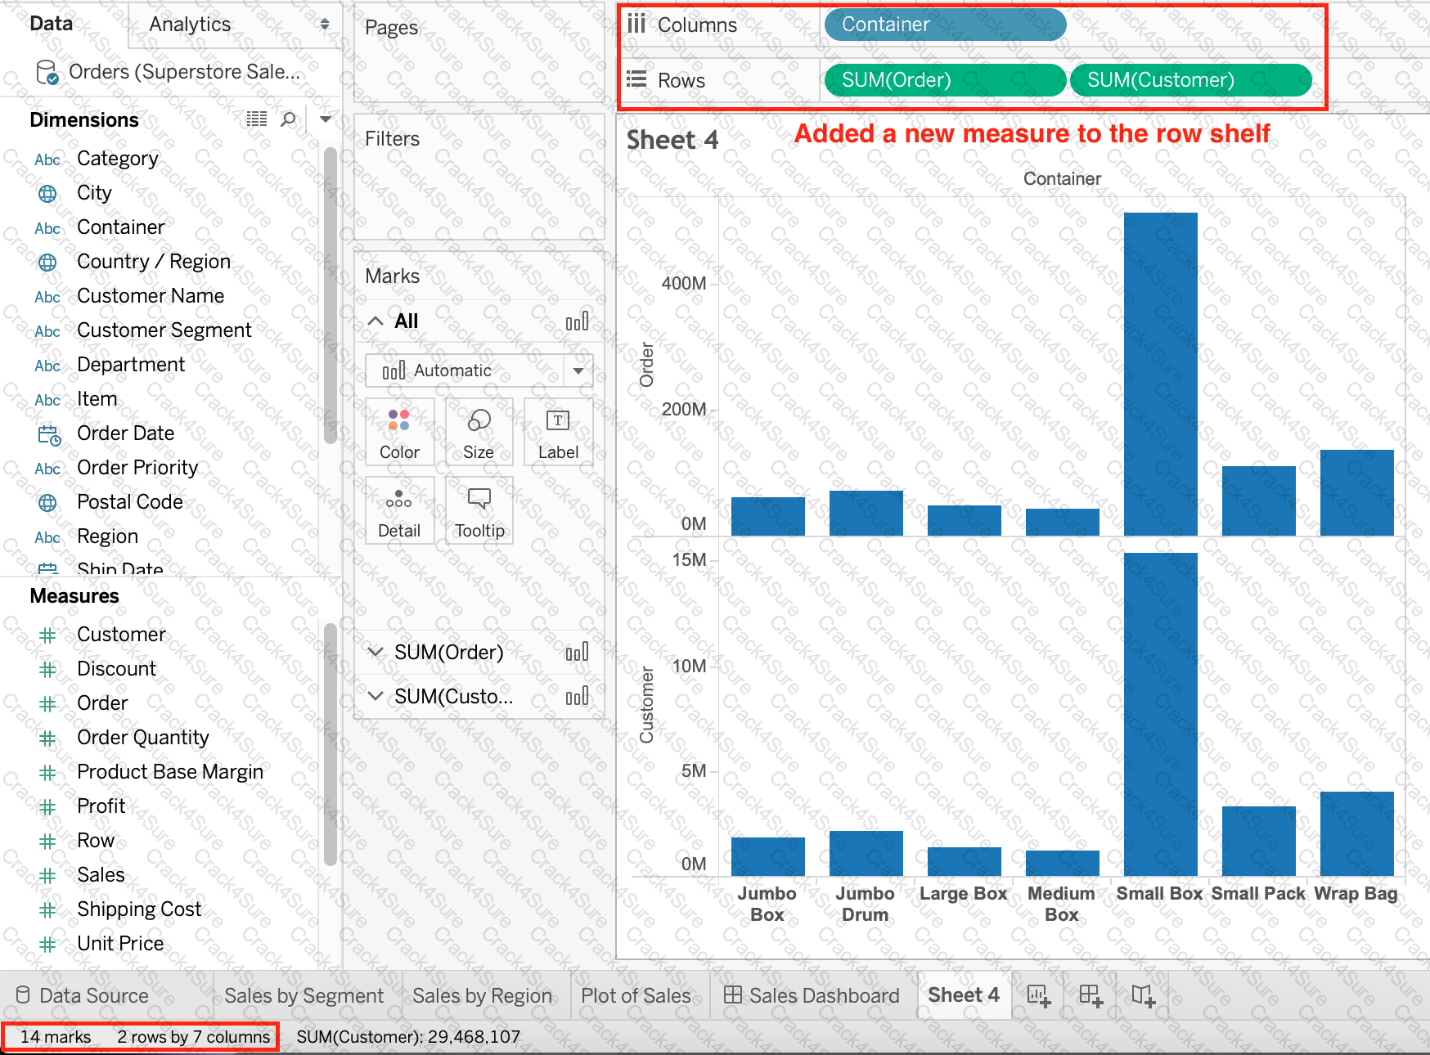 Graphical user interface, chart, bar chart
Description automatically generated with medium confidence
Graphical user interface, chart, bar chart
Description automatically generated with medium confidence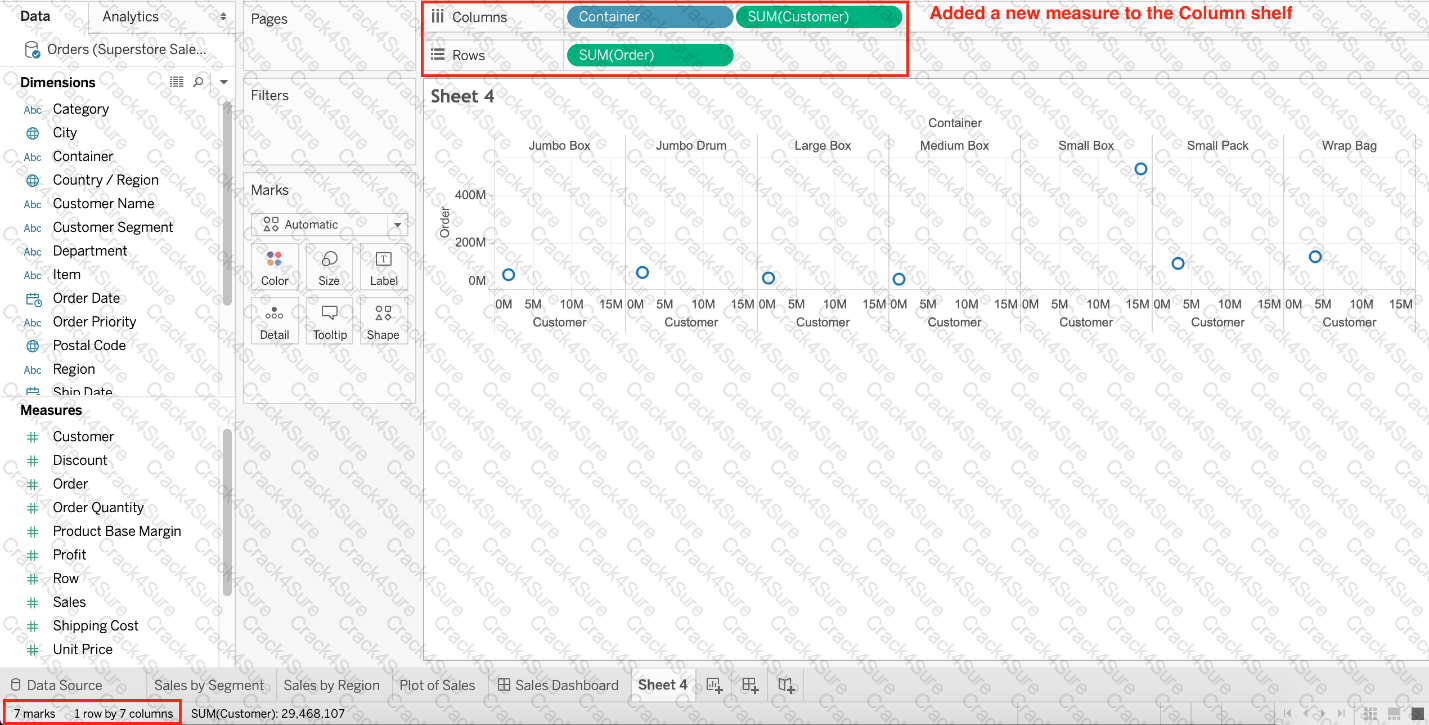 Graphical user interface, text, application
Description automatically generated
Graphical user interface, text, application
Description automatically generated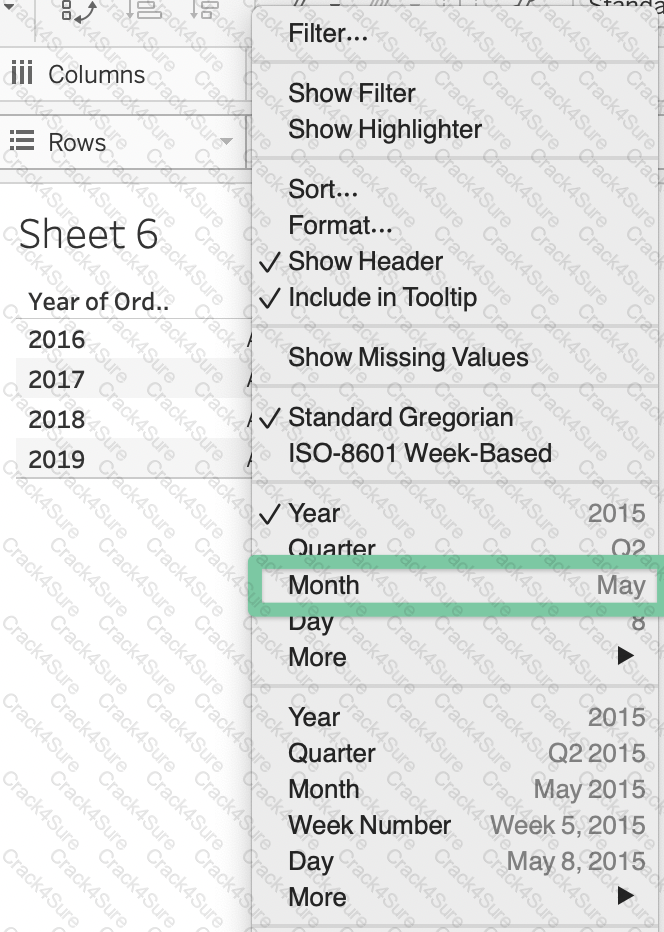
 Graphical user interface, text, application
Description automatically generated
Graphical user interface, text, application
Description automatically generated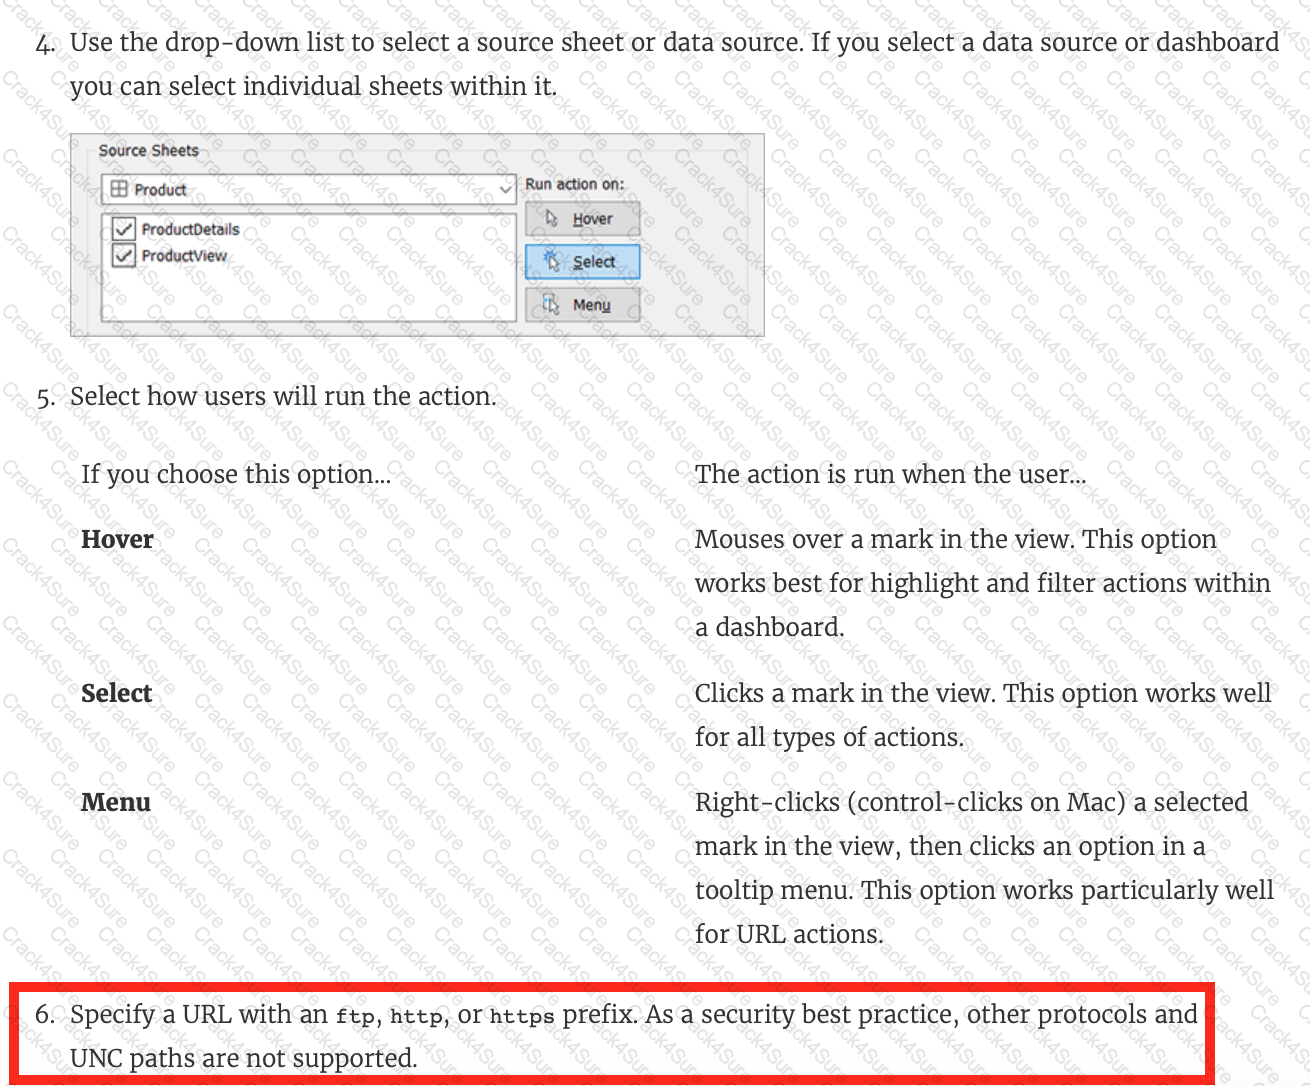 Graphical user interface, application, Word
Description automatically generated
Graphical user interface, application, Word
Description automatically generated Graphical user interface, text, application
Description automatically generated
Graphical user interface, text, application
Description automatically generated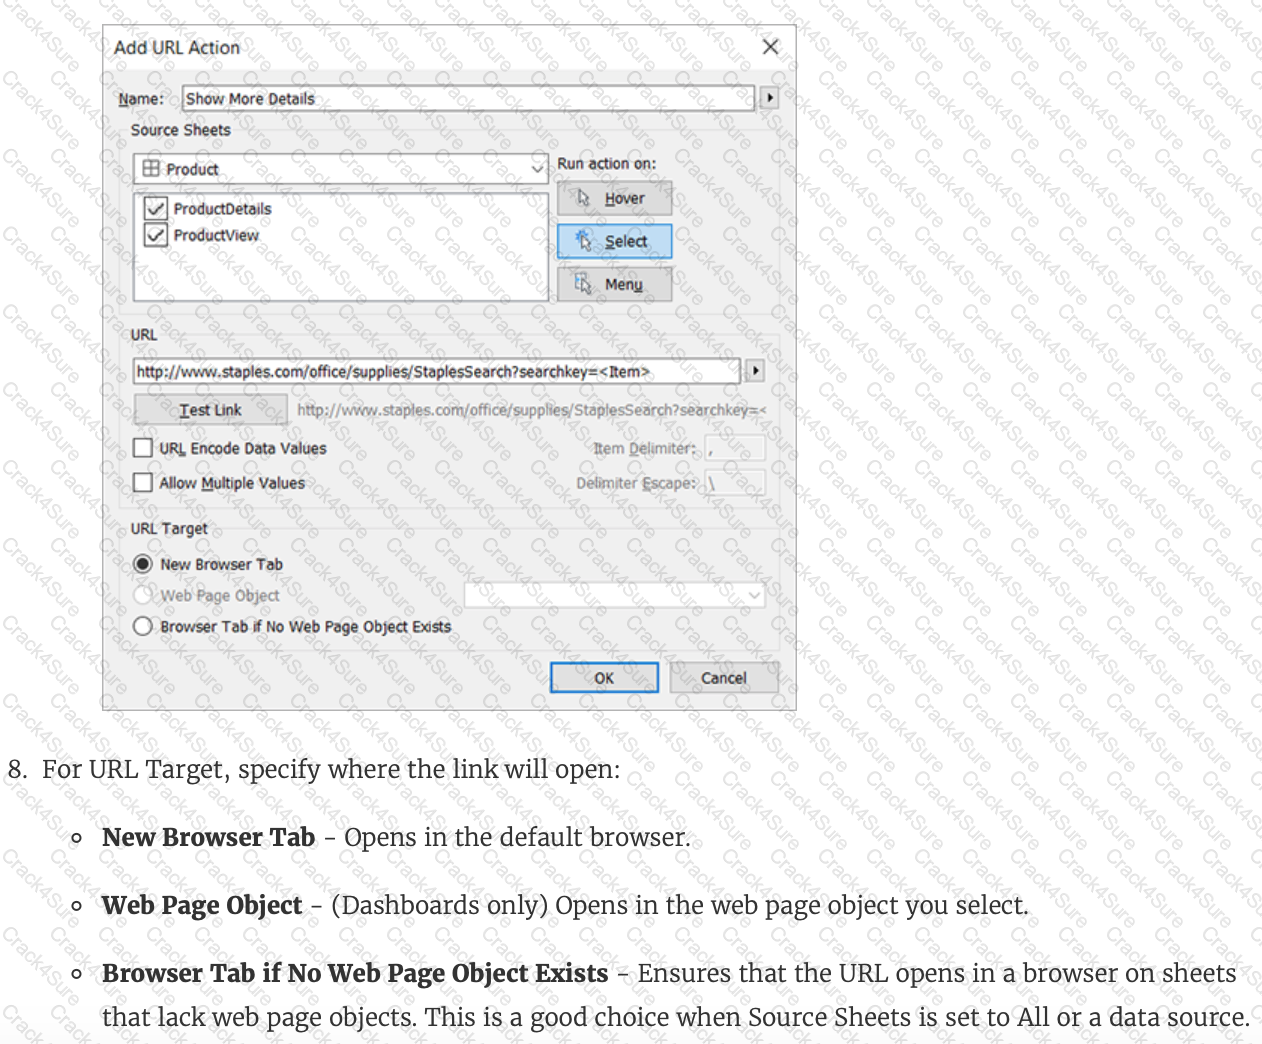 Graphical user interface, text, application
Description automatically generated
Graphical user interface, text, application
Description automatically generated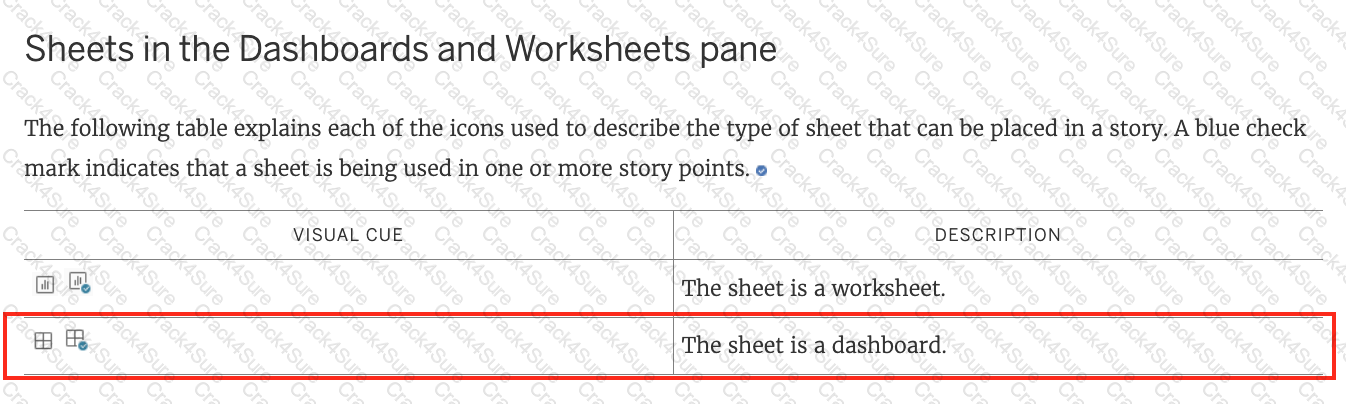
 Graphical user interface
Description automatically generated
Graphical user interface
Description automatically generated Graphical user interface, application, Word
Description automatically generated
Graphical user interface, application, Word
Description automatically generated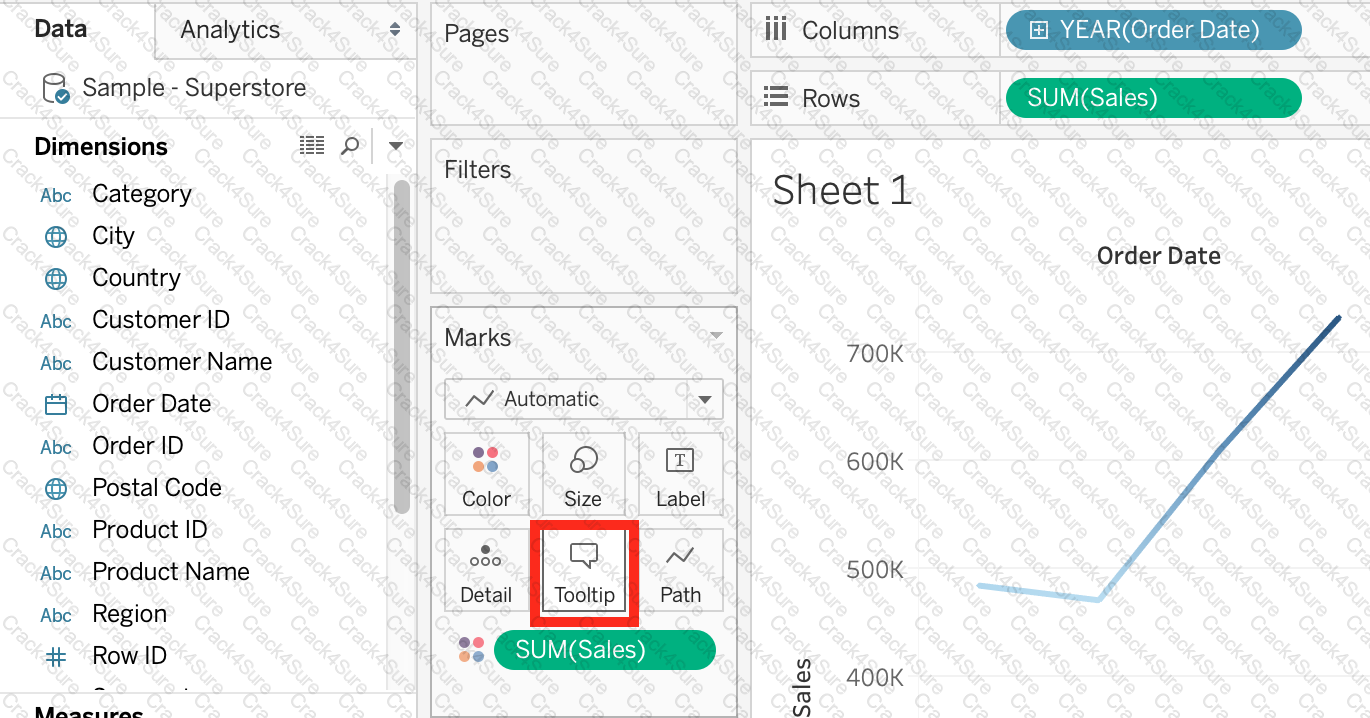 Graphical user interface, application
Description automatically generated
Graphical user interface, application
Description automatically generated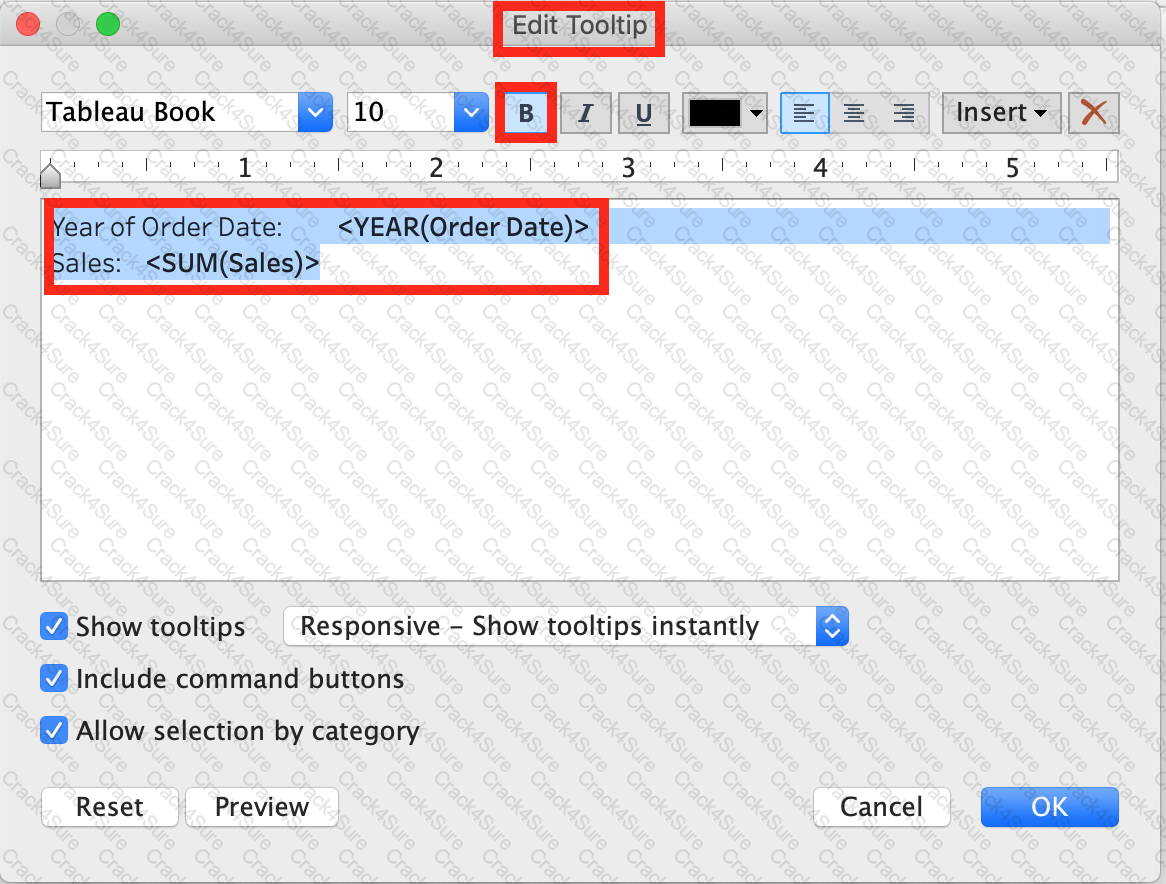 Graphical user interface, application, Word
Description automatically generated
Graphical user interface, application, Word
Description automatically generated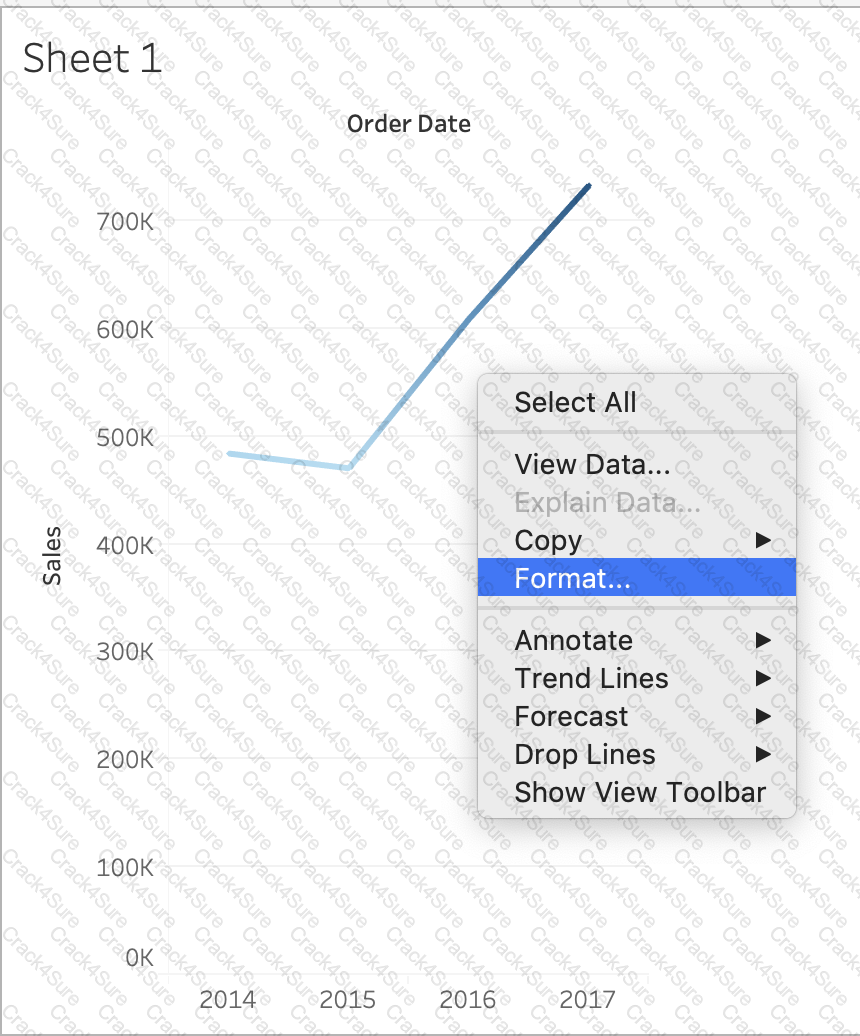 A picture containing line chart
Description automatically generated
A picture containing line chart
Description automatically generated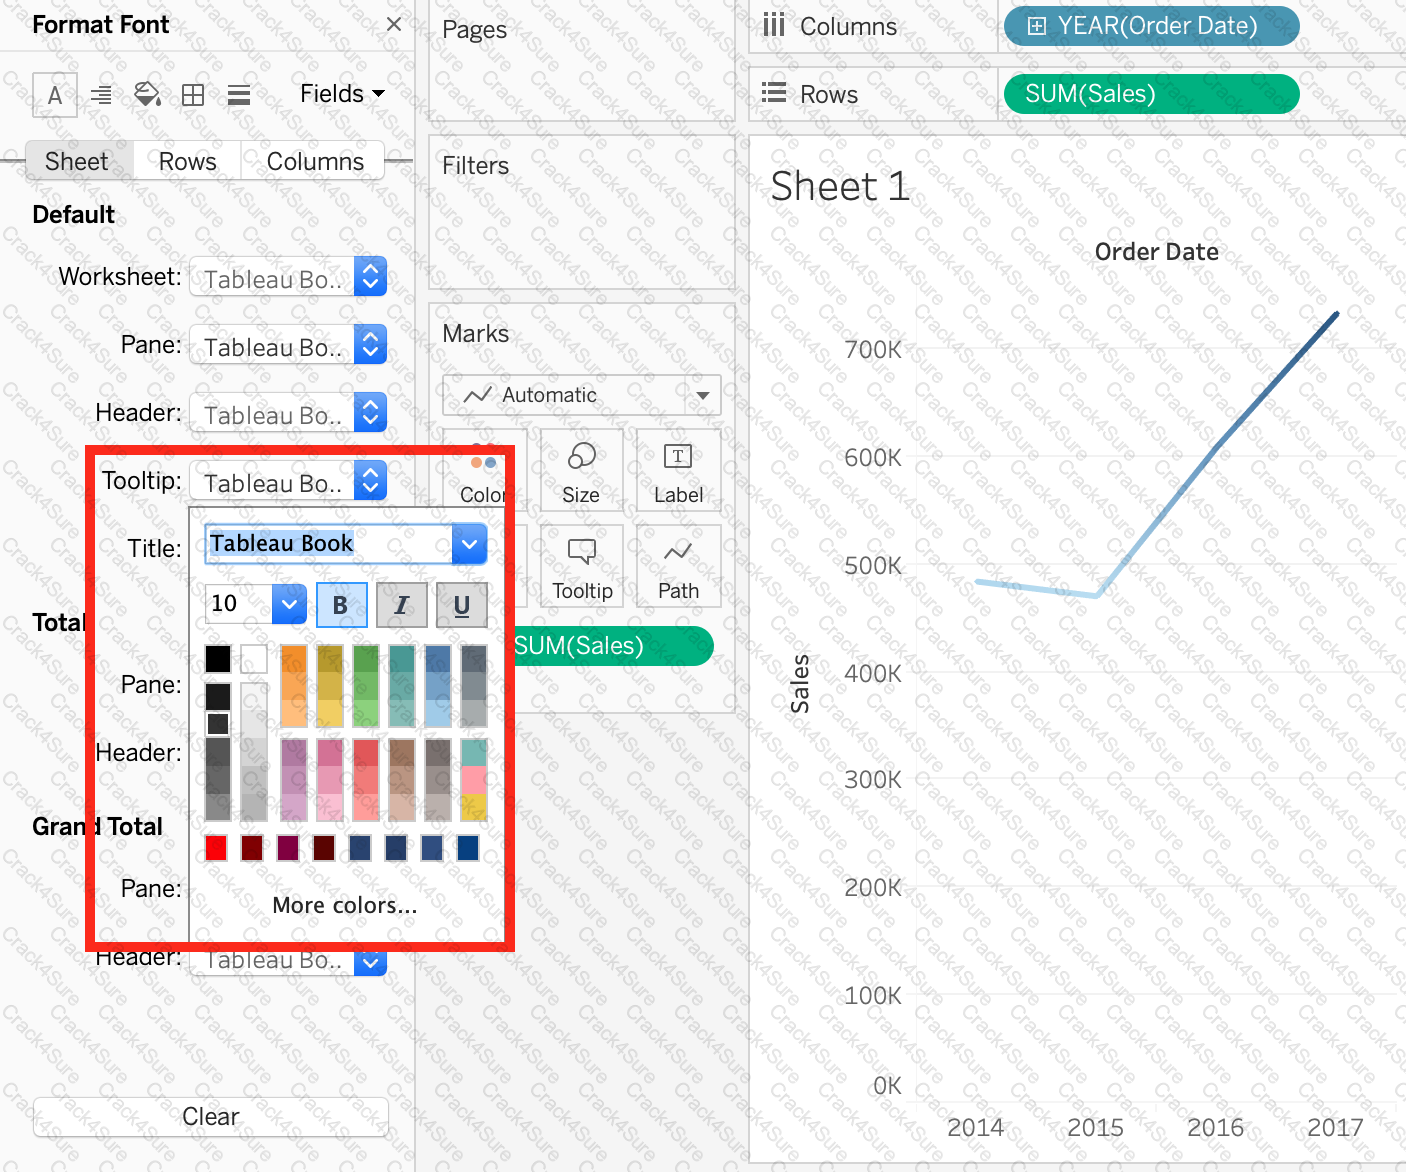 Graphical user interface
Description automatically generated
Graphical user interface
Description automatically generated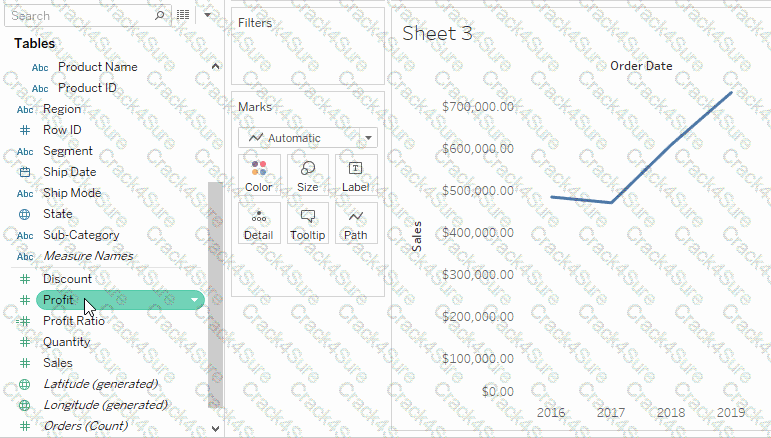

 Graphical user interface, text, application, Word
Description automatically generated
Graphical user interface, text, application, Word
Description automatically generated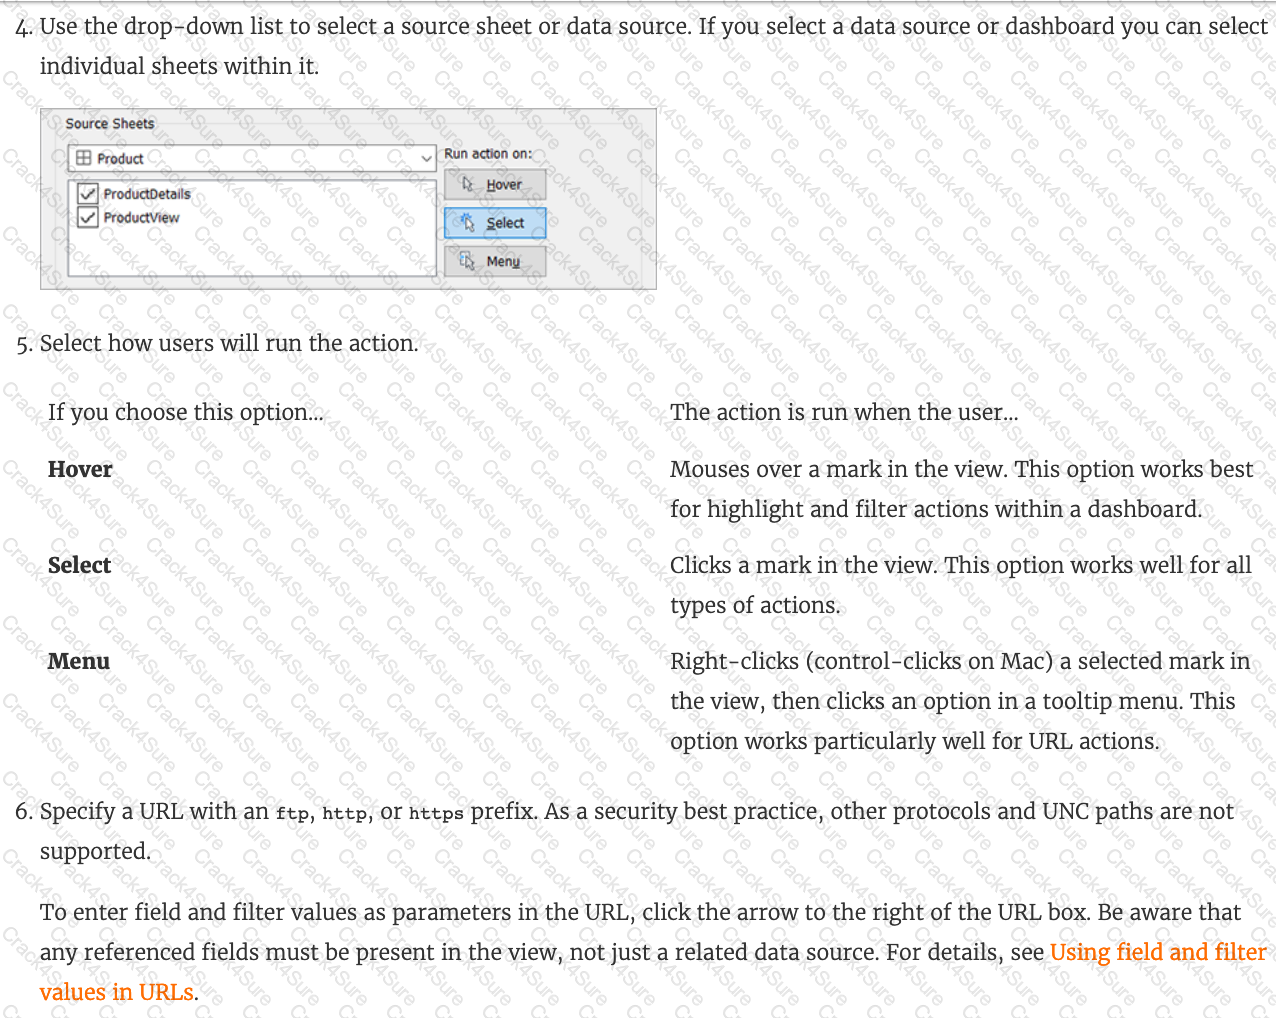 Graphical user interface, text, application, email
Description automatically generated
Graphical user interface, text, application, email
Description automatically generated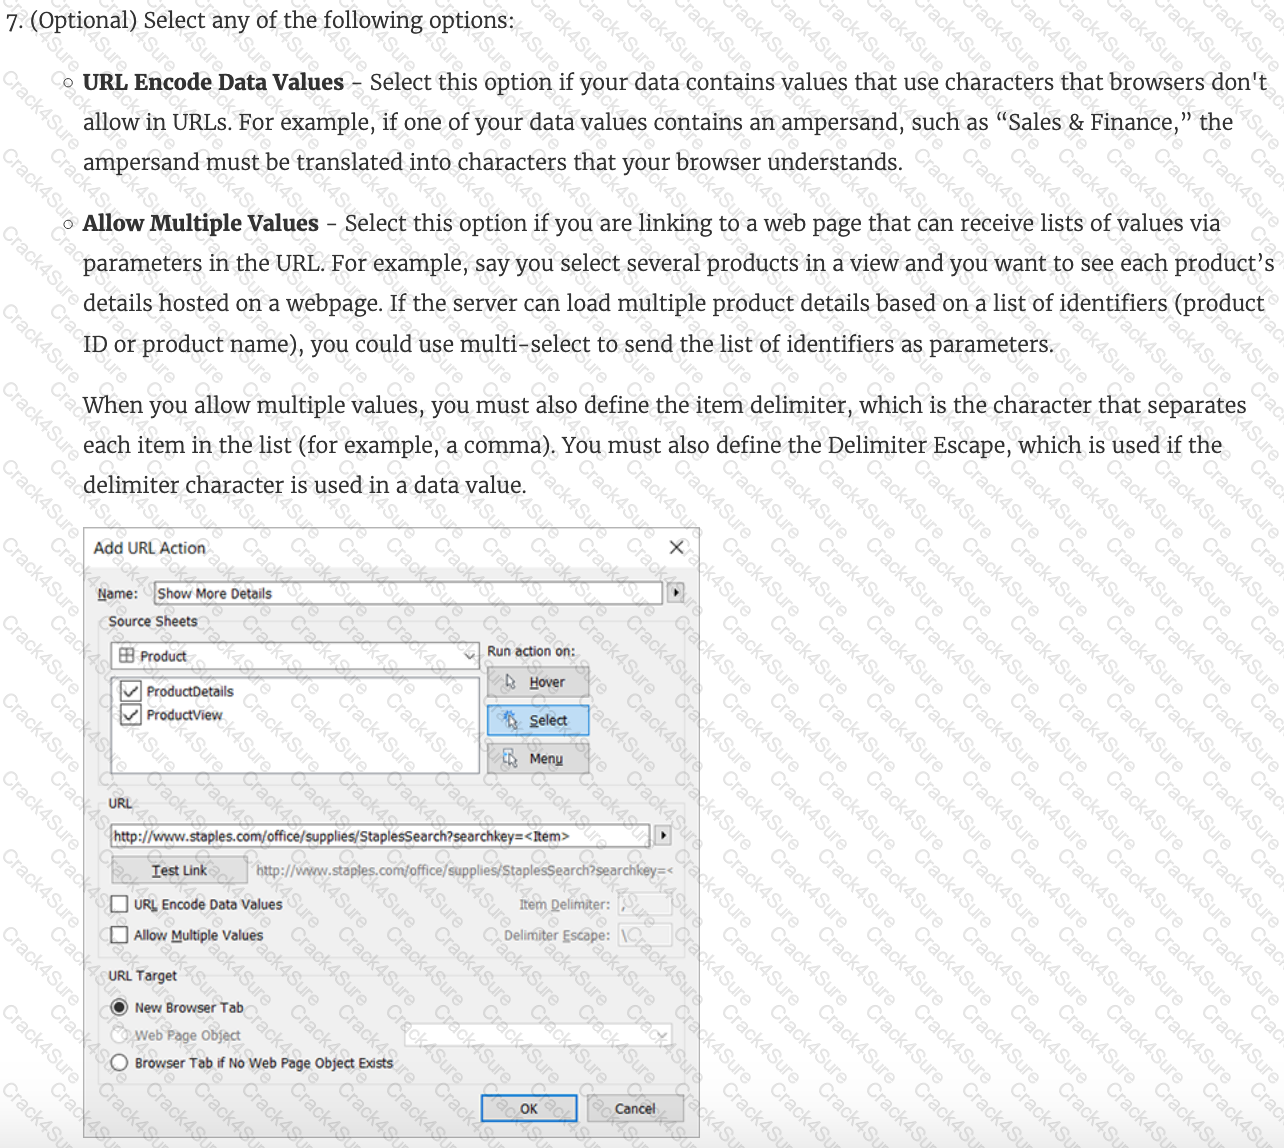 Graphical user interface, text, application, Word
Description automatically generated
Graphical user interface, text, application, Word
Description automatically generated Text, letter
Description automatically generated
Text, letter
Description automatically generated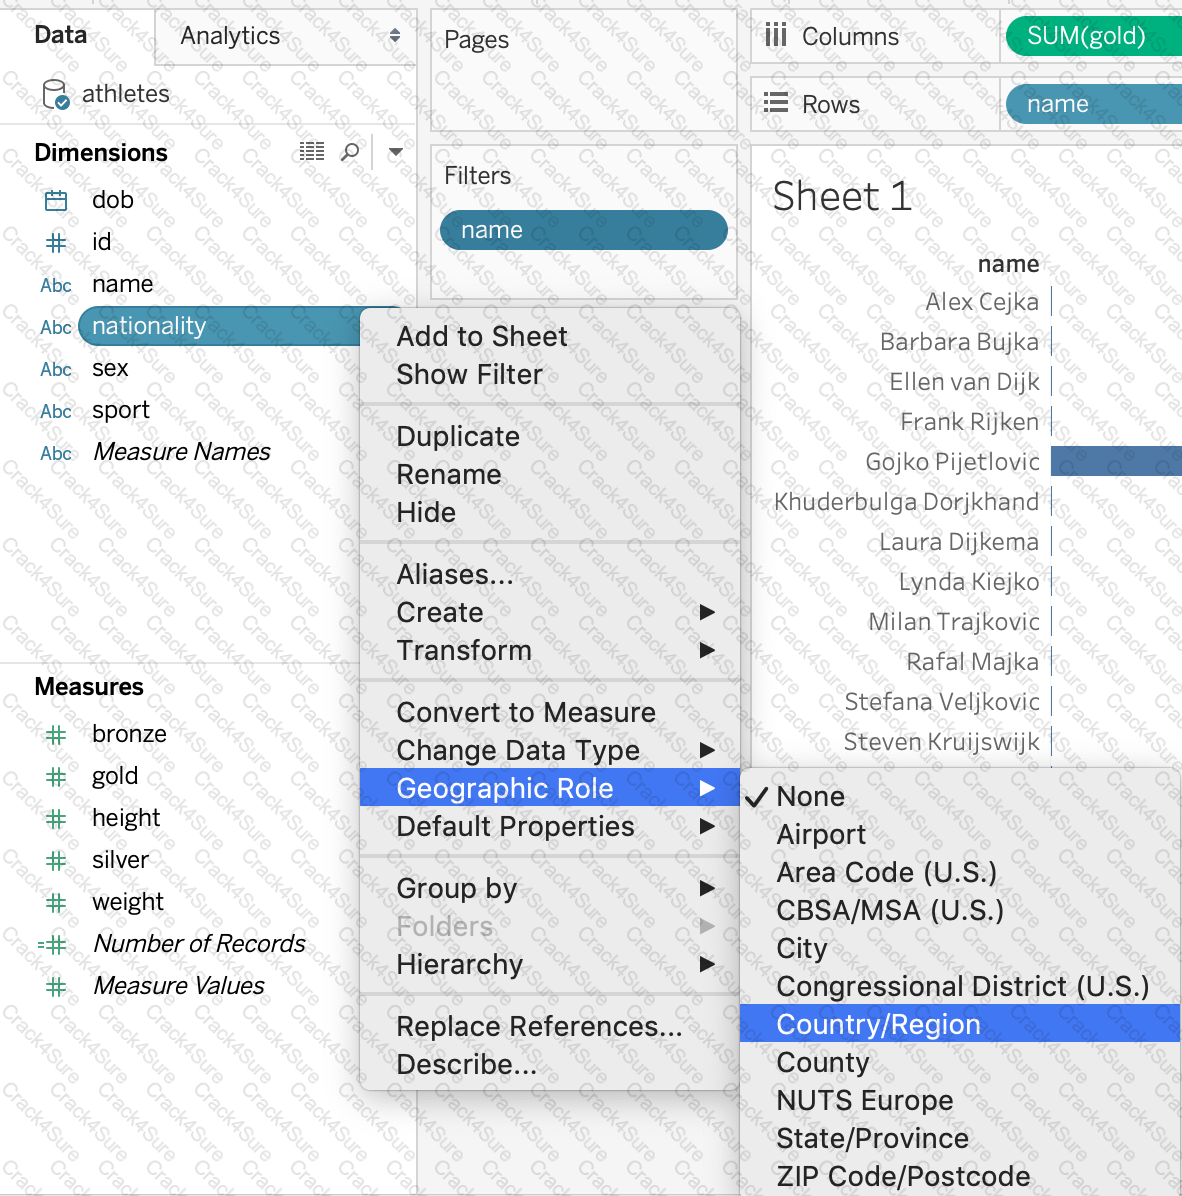
 Graphical user interface, application
Description automatically generated
Graphical user interface, application
Description automatically generated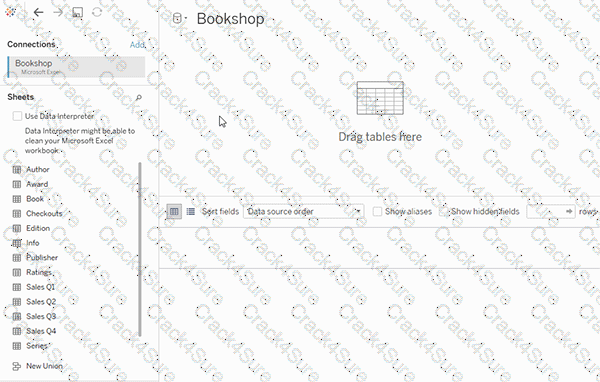
 Graphical user interface, text, application
Description automatically generated
Graphical user interface, text, application
Description automatically generated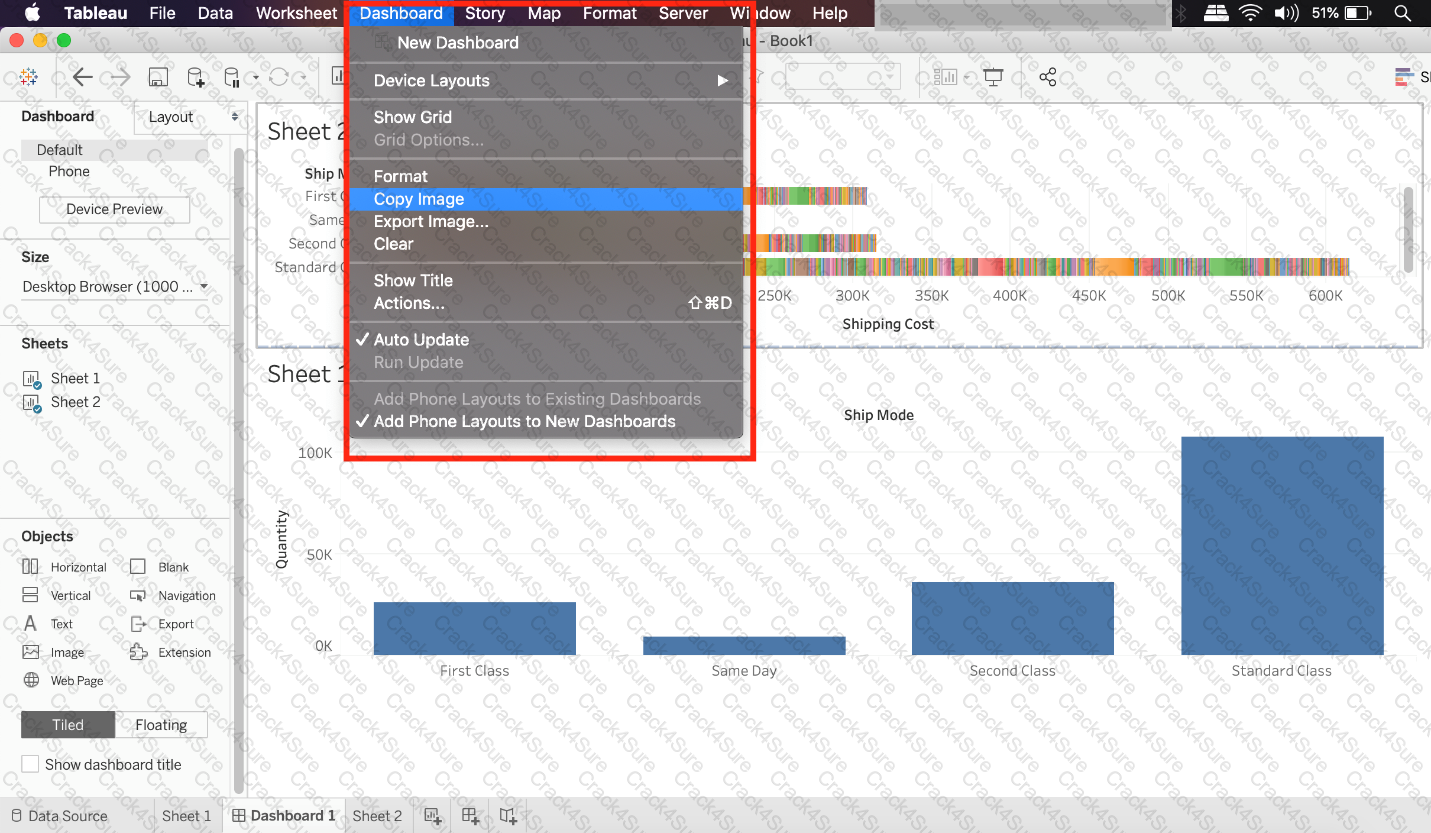

 Graphical user interface, text, application, email
Description automatically generated
Graphical user interface, text, application, email
Description automatically generated Table
Description automatically generated
Table
Description automatically generated Table
Description automatically generated
Table
Description automatically generated Table
Description automatically generated
Table
Description automatically generated Table
Description automatically generated
Table
Description automatically generated

 Graphical user interface, text, application, email
Description automatically generated
Graphical user interface, text, application, email
Description automatically generated