We at Crack4sure are committed to giving students who are preparing for the Tableau TDA-C01 Exam the most current and reliable questions . To help people study, we've made some of our Tableau Certified Data Analyst Exam exam materials available for free to everyone. You can take the Free TDA-C01 Practice Test as many times as you want. The answers to the practice questions are given, and each answer is explained.
You have the following data source in tableau Server.
You need to ensure that the data is updated every hour.
What should you select?
You are the owner of an alert.
You receive an email notification that the alert was suspended
From where can you resume the suspended alert?
You want to add a comment to March 2020 as shown in the following visualization.
You have the following sets in a Tableau workbook
• Top N Customers
• Customers of 2020
• Top N Products
• Sellers of 2020
Which two sets can you combine? Choose two
Open the link to Book1 found on the desktop. Open the Line worksheet.
Modify the chart to show only main and max values of both measures in each region.
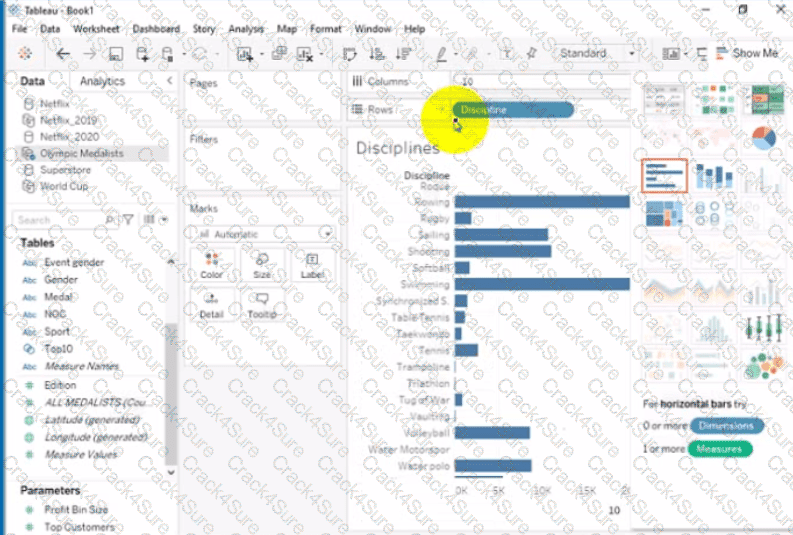
Open the link to Book1 found on the desktop. Open Disciplines worksheet.
Filter the table to show the Top 10 NOC based on the number of medals won.
Open the link to Book1 found on the desktop. Open SalesVSProfit worksheet.
Add a distribution band on Profit to show the standard deviation from- 1 to 1.
Open the link to Book1 found on the desktop. Open Disciplines worksheet.
Filter the table to show the members of the Top10 set and the members of the Bottom10 set. There should be a total of 20 rows.
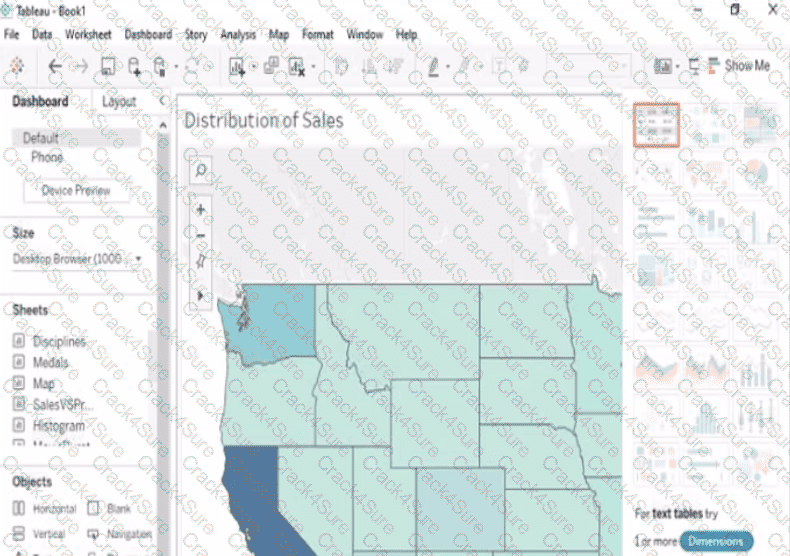
Open the link to Book1 found on the desktop. Open the sales dashboard.
Add the Sales by State sheet in a Show/Hide button to the right side of the dashboard.
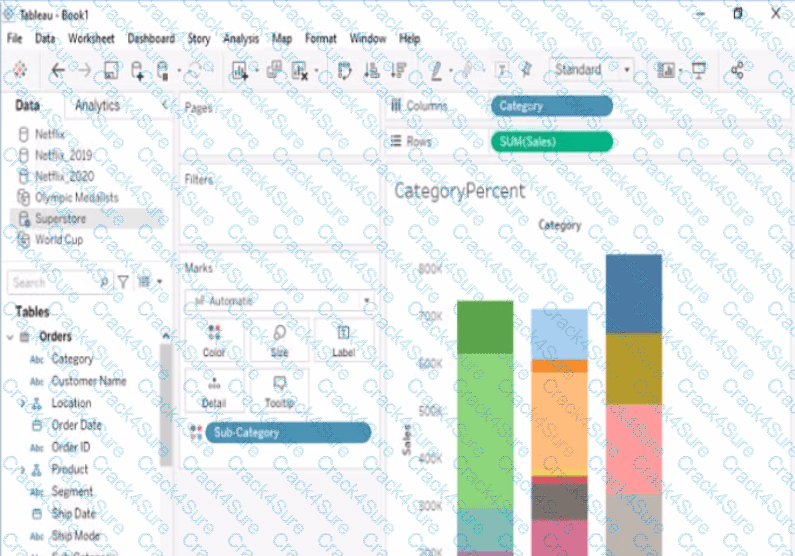
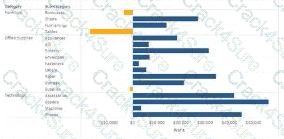
Open the link to Book1 found on the desktop. Open the CategoryPercentage worksheet.
Modify the bar chart show the percentage of sales for each Subcategory within every Category. The total percentage for every Category must be 100%.
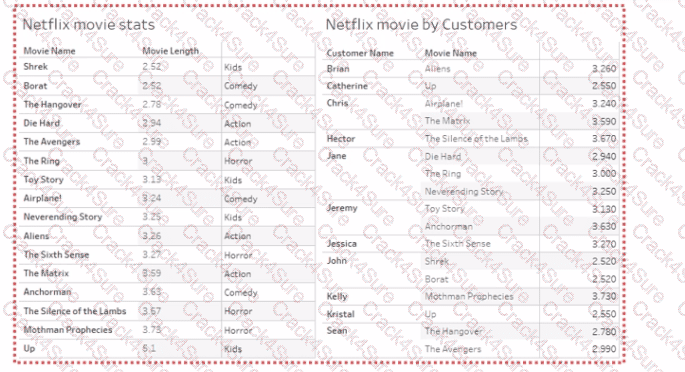
Open the link to Book1 found on the desktop. Open the Movie Durations worksheet.
Replace the existing data source with the Netflix_2019 data source.
Open the Link to Book1 found on the desktop. Open Map worksheet and use Superstore data source.
Create a filed map to show the distribution of total Sales by State across the United States.
Open the link to Book1 found on the desktop. Use the Superstore data source.
Split the Customer Name field into two fields named First Name and Last Name.
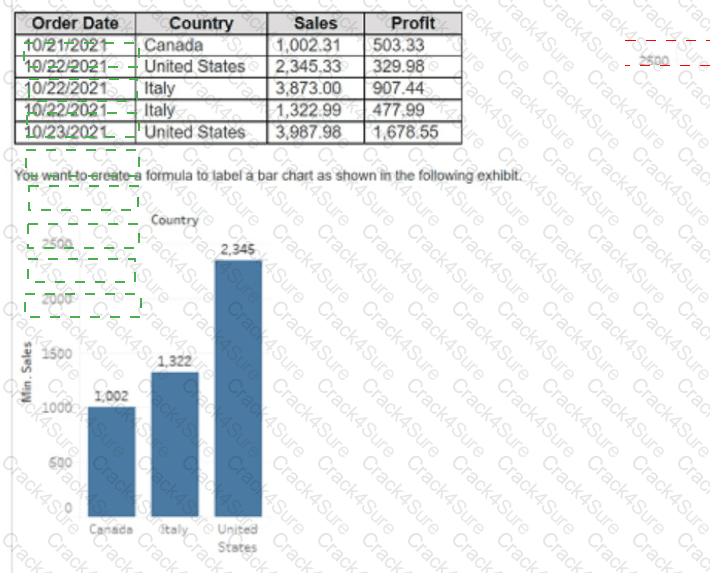
You have a table that contains the following data.
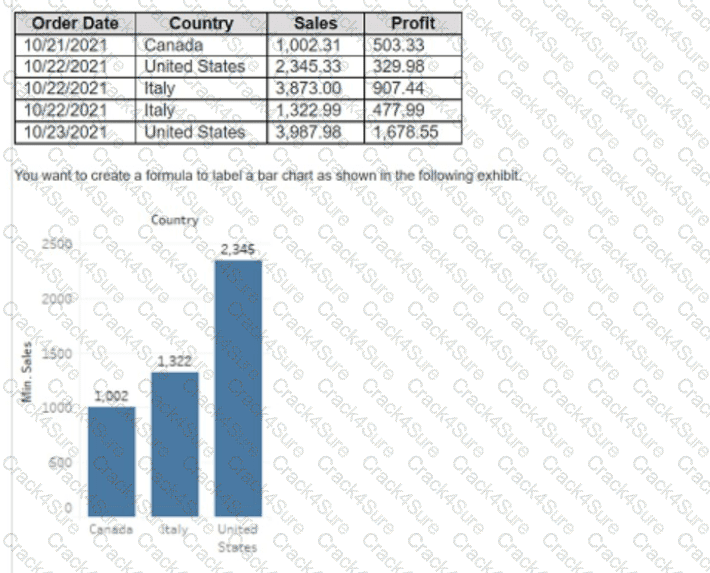
How should you complete the formula? (Drag the appropriate Options to the Answer Area and drop into the correct locations.)
When a Data Analyst needs to format workbook settings, which options are available in the Format Workbook panel?
You want to create the following dashboard that will contain two sheets.
What should you do?
You want to create the following table in a view.
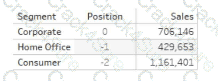
Which function should you use to create the Position column?
Open the link to Book1 found on the desktop. Open the Histogram worksheet and use the Superstone data source.
Create a histogram on the Quantity field by using bin size of 3.
A Data Analyst has the following chart.
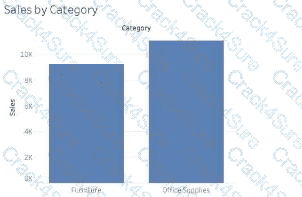
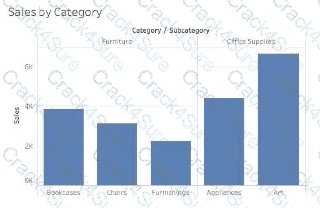
The analyst needs to enable the drilldown from Category to Subcategory as shown in the following chart.
What should the analyst create?
A Data Analyst has a large data source that contains more than 10 million rows. Users can filter the rows by a field named Animal.
The following is a sample of the data.
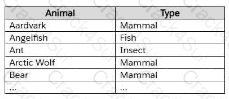
The analyst wants to ensure that every calculation is affected by including only animals of a particular type.
Which type of filter should the analyst create on the worksheet?
You create the following story that contains two story point.
You want to change the story point format to show the current story point number out of the total number of story points.
Which Layout option should you use?
A Data Analyst has the following primary data source that contairis a dimension named Dorm_Code.
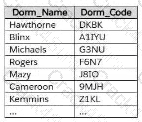
The analyst receives the following secondary data source that contains updated dorm codes.
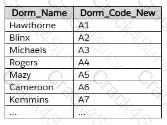
The analyst needs to bring the updated dorm codes into Tableau and use the codes in existing visualizations. The new dorm codes must use the existing field name of Dorm_Code.
What should the analyst do?
You have the following chart that sorts states by the number of products each state has purchased.
Which formula should you use to include a number with the position of each state within each region?
You have the following two tables.
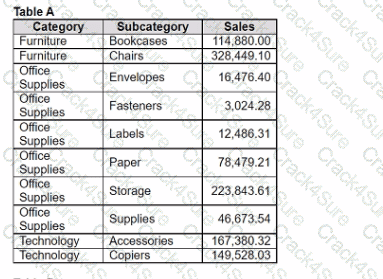
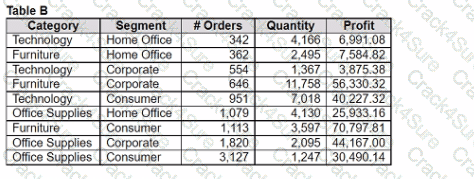
Table A is the primary table.
Which type of join is established when a blend is created by using the join key of Category?
You have the following dataset.
Which grouping option should you use m Tableau Prep to group al five names automatically?
A Data Analyst is creating a new dashboard.
The analyst needs to add a button to the dashboard that allows users to export the dashboard as an image.
Which type of object should the analyst use?
What should a Data Analyst use to visualize the distribution and variability of measure values along an axis?
You have a data source that contains 20 tables.
You want the tables to be organized within the Data pane based on the type of data contained within the tables.
What should you use?
You have the following Map.
You need the map to appear as shown in the following visualization.
What should you do?
A Data Analyst has the following sets in a Tableau workbook:
Top N Customers
Customers of 2024
Top N Products
Sellers of 2024
Which two sets can the analyst combine? (Choose two.)
A Data Analyst has the following worksheet, with Profit data for Categary and Sub-Categury.
The analyst executed the following calculated field at the Total level:
COUNTD( IF ( INCLUDE [Sub-Category]: SUM([Profit]) < 0 THEN [Category] END )
What is the result?
in which three formats can you export a worksheet from the Worksheet menu? Choose three
3 Months Free Update
3 Months Free Update
3 Months Free Update

TESTED 09 Jul 2026