We at Crack4sure are committed to giving students who are preparing for the Salesforce Analytics-DA-201 Exam the most current and reliable questions . To help people study, we've made some of our Salesforce Certified Tableau Data Analyst exam materials available for free to everyone. You can take the Free Analytics-DA-201 Practice Test as many times as you want. The answers to the practice questions are given, and each answer is explained.
A Data Analyst has a data source that contains data for every city in the United States. The following is a sample of the data.
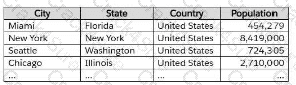
The analyst needs to use the City dimension to create a dynamic filter that shows the cities that have a population greater than 1 million.
Which type of filter should the analyst use?
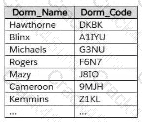
A Data Analyst has the following primary data source that contairis a dimension named Dorm_Code.
The analyst receives the following secondary data source that contains updated dorm codes.
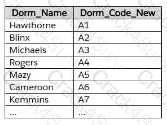
The analyst needs to bring the updated dorm codes into Tableau and use the codes in existing visualizations. The new dorm codes must use the existing field name of Dorm_Code.
What should the analyst do?
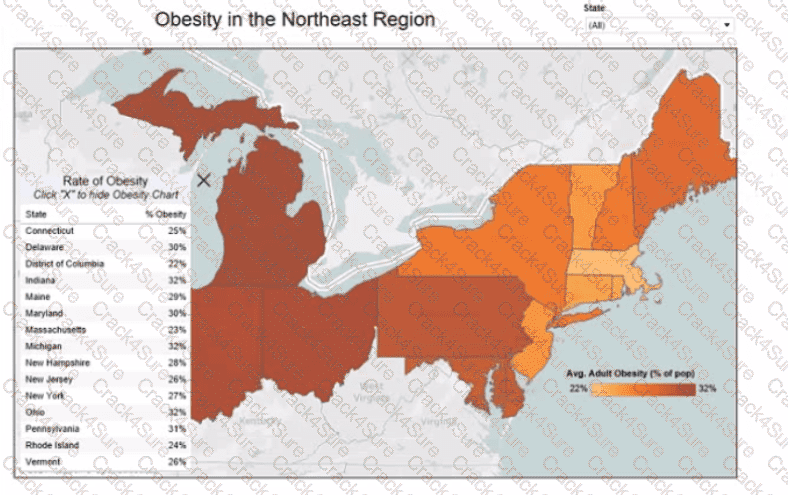
You have the following map.
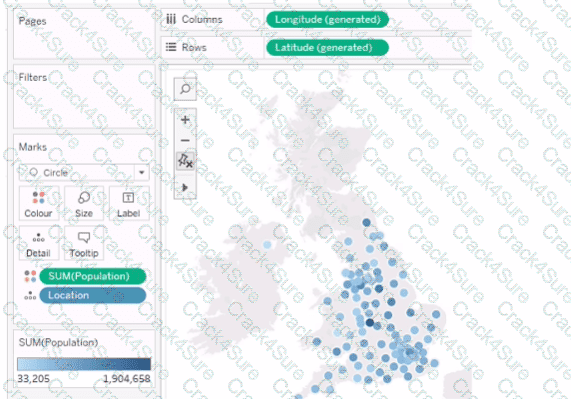
You need the map to appear as shown in the following visualization.
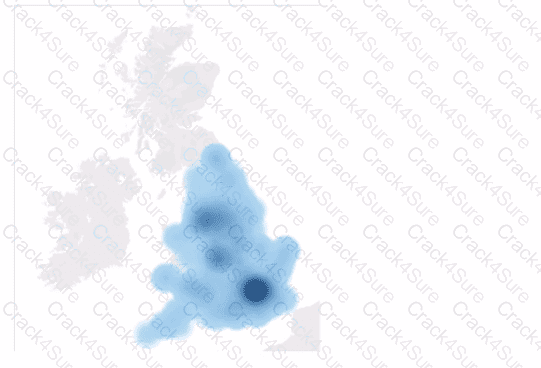
What should you do?
You want to create the following table in a view.
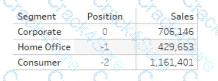
Which function should you use to create the Position column?
In a dataset, a Data Analyst has a string field named Category that contains unnecessary trailing spaces.
Which function should the analyst use to remove the trailing spaces from the Category field?
You create a parameter named Choose Region fiat contains values from a field named Region.
You want users to be able to use the Choose Region parameter to interact with a chart by logging between different regions
What should you do next?
You create the following worksheet
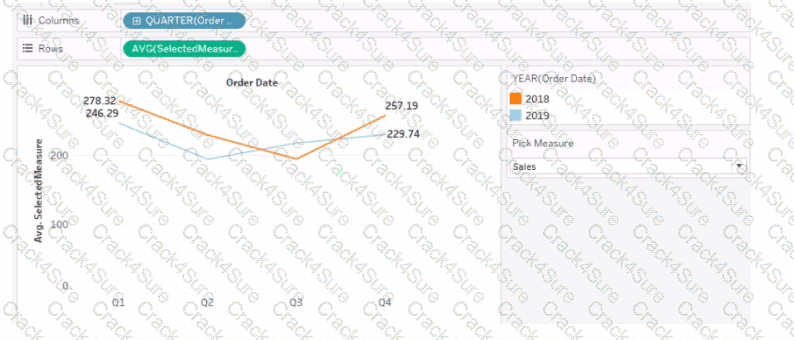
The Pick Measure parameter contains the following list of values
Users can select a value from Pick Measure to change the visualization to show either the Sales measure or the Profit measure.
Which formula is used in the Selected Measure calculated field lo switch between measures?
A colleague provides a Data Analyst with access to a folder that has the following files:
Sales.csv
Book1.json
Sales.tds
Export.mdb
Which file can contain information for connecting to an external data source, such as an SQL Server database?
You have the following dashboard.
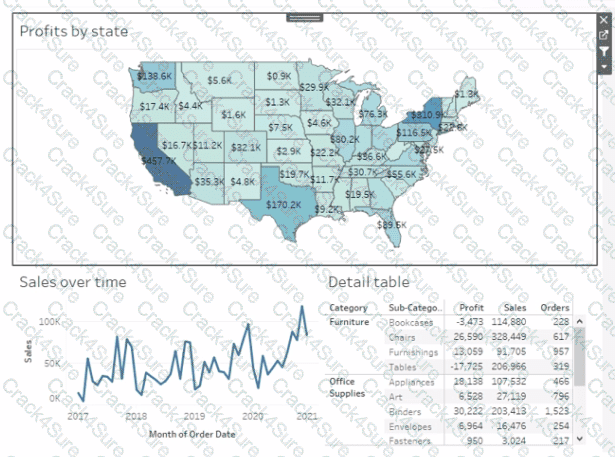
From the context menu of Sales over time, select Ignore Actions.
Several Lays later, you decide that you want to filter both Sales over time and Detail table by selecting a data point on the map.
What should you do?
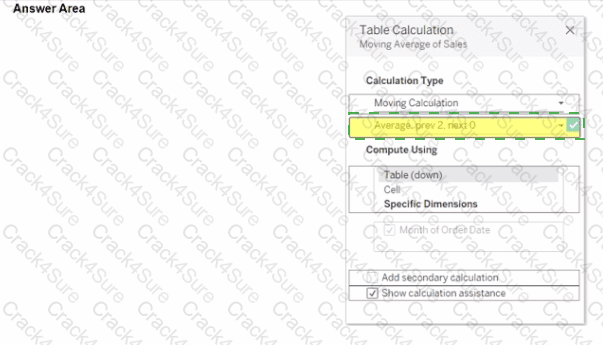
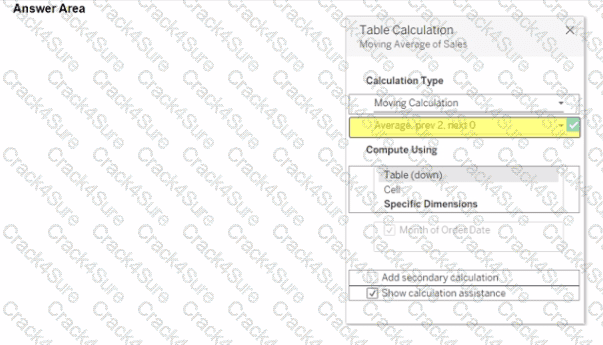
You use a quick table calculation lo calculate the moving average of a measure named Sales.
You need to calculate the moving averages of the last three years.
Which setting should you change in the Table Calculation dialog box? {Click the appropriate Option in the Answer Area)
in which three formats can you export a worksheet from the Worksheet menu? Choose three
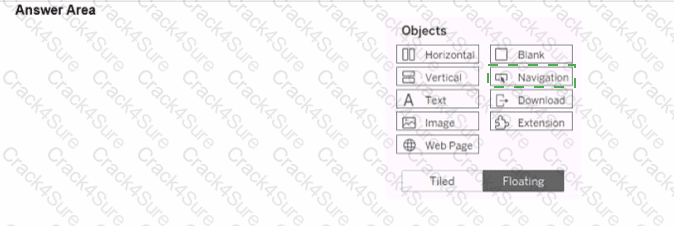
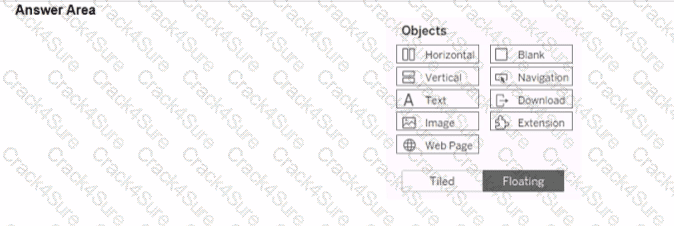
You have a dashboard than contains two sheets named Sheet 1 and Sheet 2.
You want to add an object to the dashboard that users can click to switch to a different dashboard in the workbook.
Which object should you add to the dashboard?
A Data Analyst has the following chart that shows the sum of sales made in different cities.
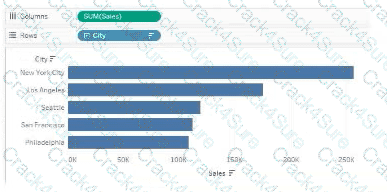
The analyst wants to show the average sale amount for a city when users hover their mouse over any of the bars.
What should the analyst do?
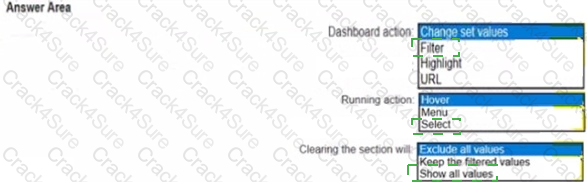
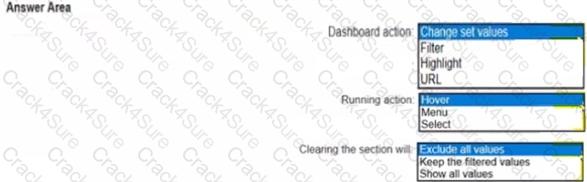
You have the following dashboard.
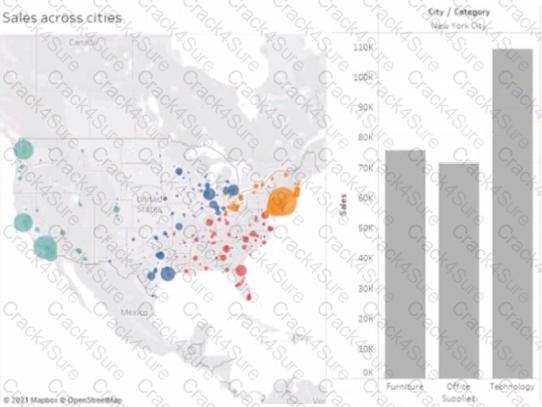
When a user selects a only on the map the data on the bar chart must show only the data for the selected city. The data in the bar chart must change only when the user selects a different city How should you configure the dashboard action? (Use the dropdowns in the Answers Area to select the correct options.)
You have the following box plot that shows the distribution of average profits made in every state by region.
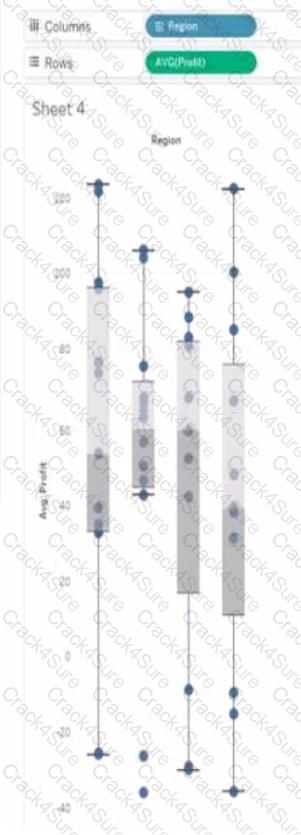
Which region has the smallest distribution of profits?
You have the Mowing dashboard.
Which two elements are floating? Choose two.
You are the owner of an alert.
You receive an email notification that the alert was suspended
From where can you resume the suspended alert?
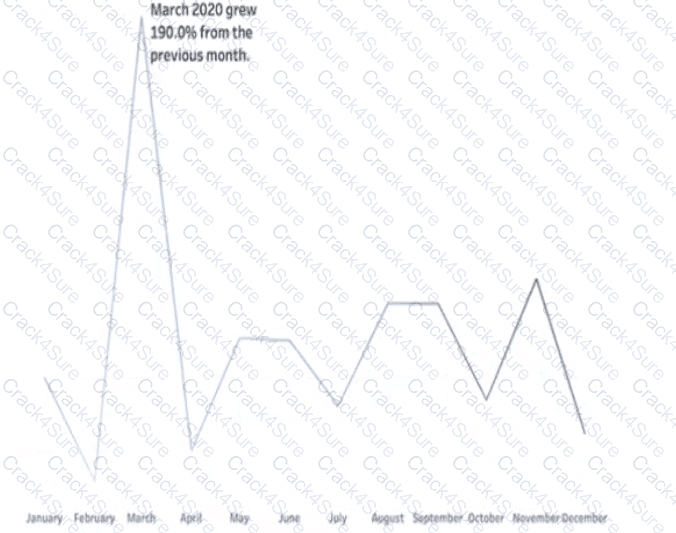
You want to add a comment to March 2020 as shown in the following visualization.
You have the following sets in a Tableau workbook
• Top N Customers
• Customers of 2020
• Top N Products
• Sellers of 2020
Which two sets can you combine? Choose two
You have a line chart on a worksheet.
You want to add a comment to March 2020 as shown in the following visualization.
What should you do?
You have the following line chart that shows the average sales by month.
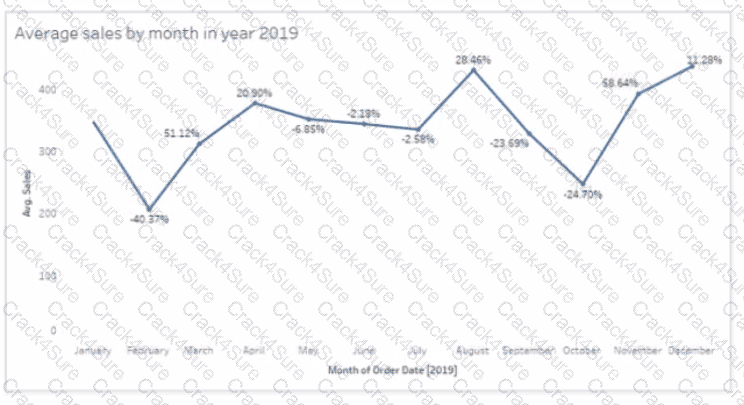
Which month had the biggest increase in swage sales compared to me previous month in 2019?
You publish a dashboard tut uses an attract. The extract refreshes every Monday at 10:00.
You need to ensure that the extract also refreshes on the last day of the month at 18:00.
What should you do?
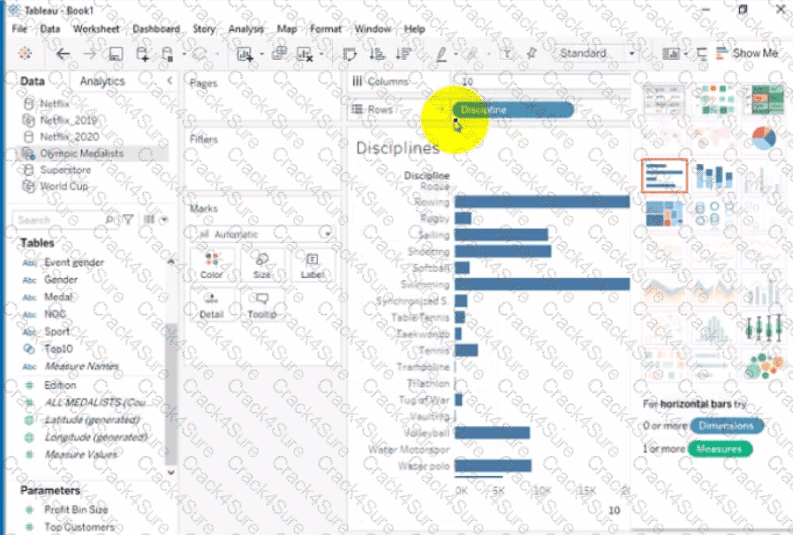
Open the link to Book1 found on the desktop. Open Disciplines worksheet.
Filter the table to show the members of the Top10 set and the members of the Bottom10 set. There should be a total of 20 rows.
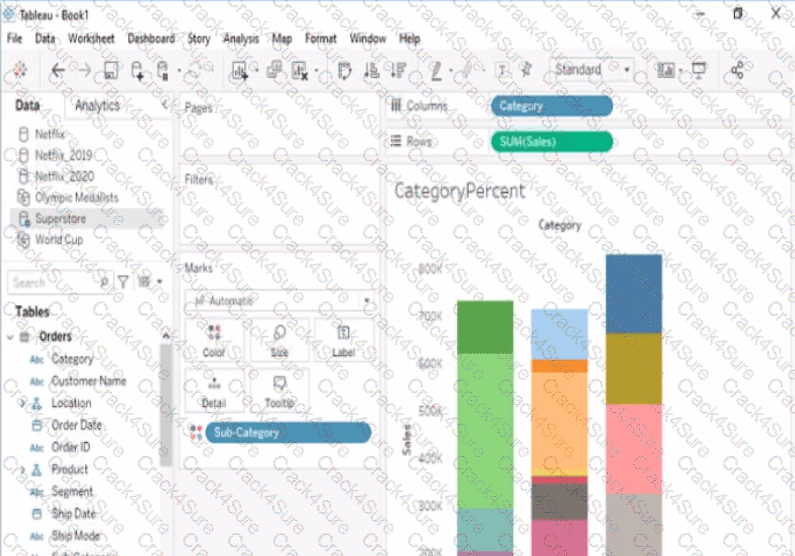
Open the link to Book1 found on the desktop. Open the CategoryPercentage worksheet.
Modify the bar chart show the percentage of sales for each Subcategory within every Category. The total percentage for every Category must be 100%.
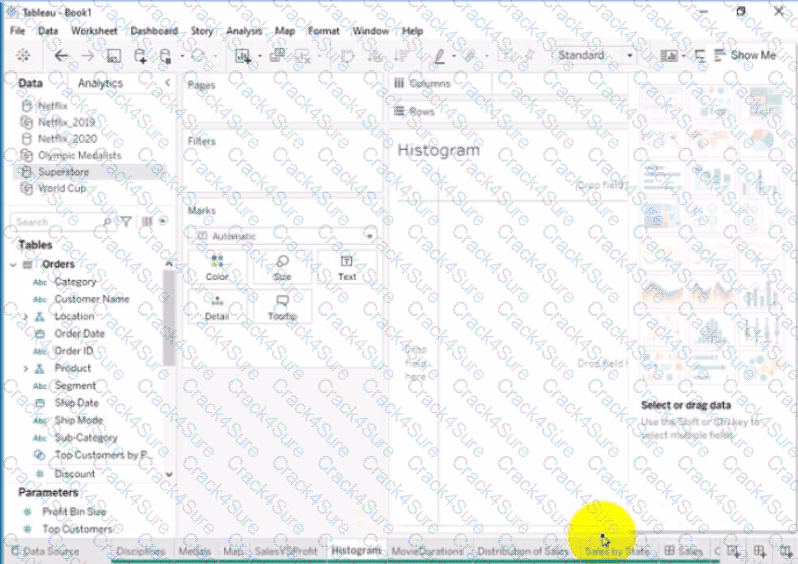
Open the link to Book1 found on the desktop. Open the Histogram worksheet and use the Superstone data source.
Create a histogram on the Quantity field by using bin size of 3.
Open the link to Book1 found on the desktop. Use the Superstore data source.
Split the Customer Name field into two fields named First Name and Last Name.
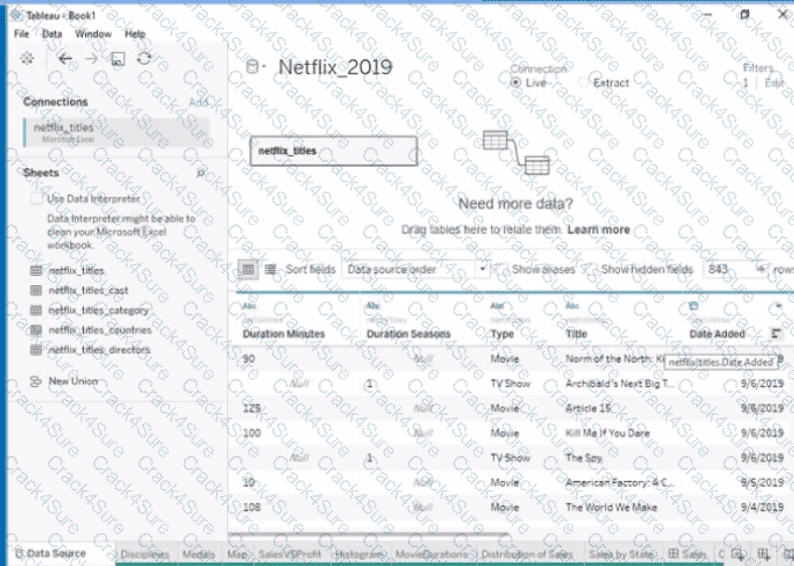
Open the link to Book1 found on the desktop. Open the Movie Durations worksheet.
Replace the existing data source with the Netflix_2019 data source.
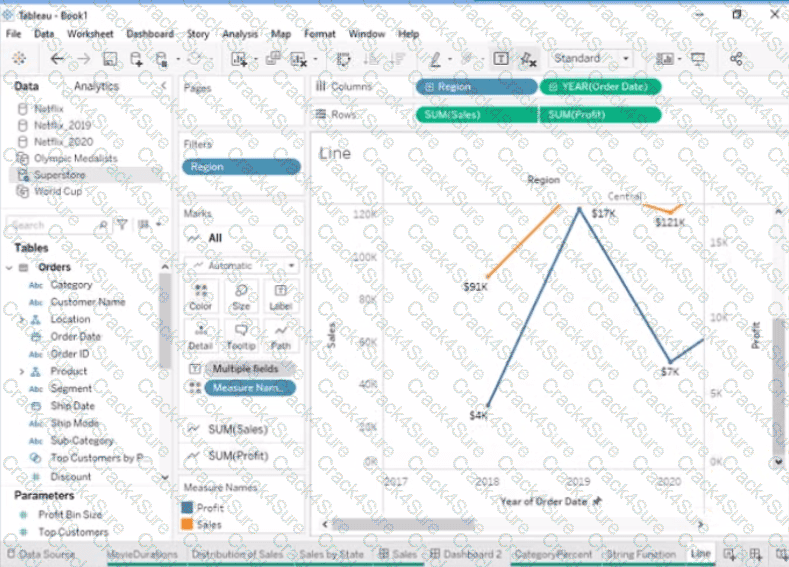
Open the link to Book1 found on the desktop. Open the Line worksheet.
Modify the chart to show only main and max values of both measures in each region.
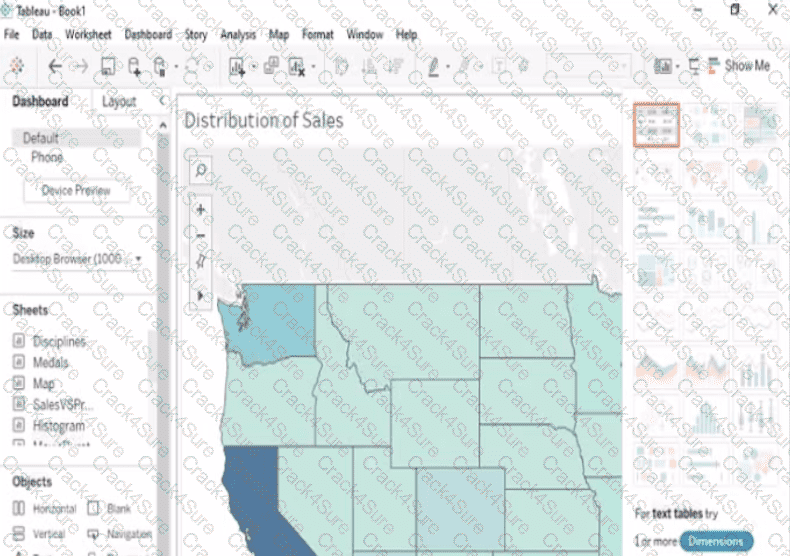
Open the Link to Book1 found on the desktop. Open Map worksheet and use Superstore data source.
Create a filed map to show the distribution of total Sales by State across the United States.
Open the link to Book1 found on the desktop. Open the sales dashboard.
Add the Sales by State sheet in a Show/Hide button to the right side of the dashboard.
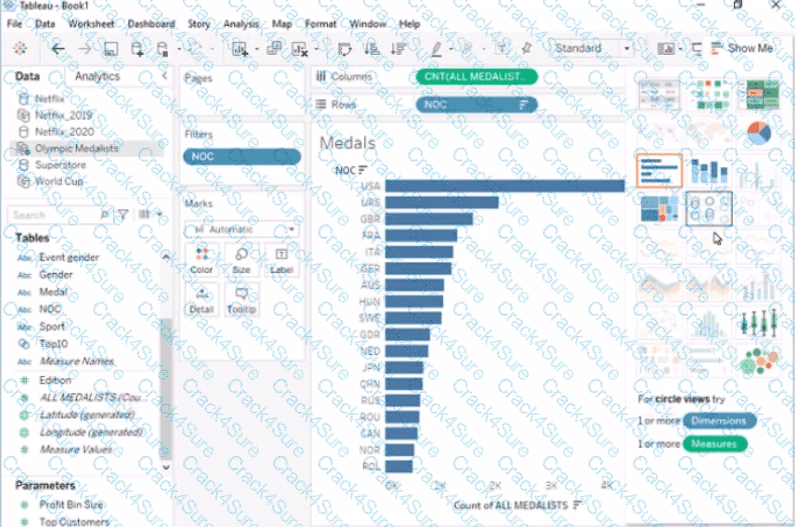
Open the link to Book1 found on the desktop. Open Disciplines worksheet.
Filter the table to show the Top 10 NOC based on the number of medals won.
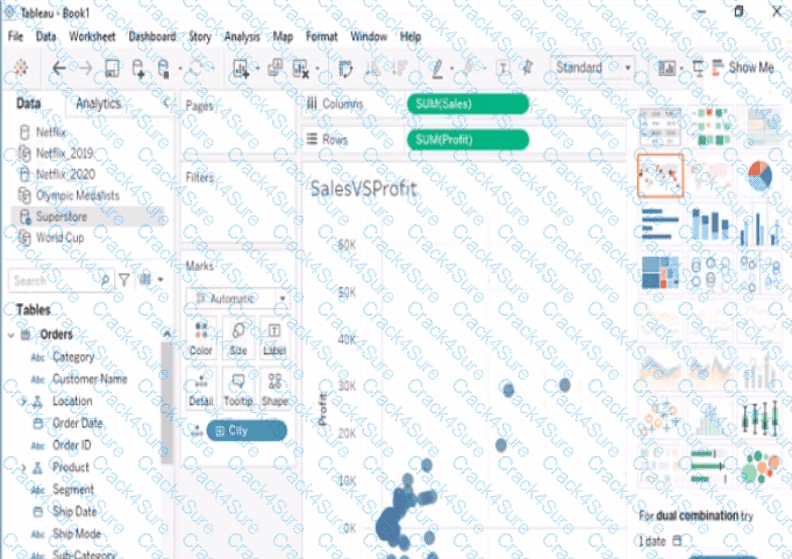
Open the link to Book1 found on the desktop. Open SalesVSProfit worksheet.
Add a distribution band on Profit to show the standard deviation from- 1 to 1.
3 Months Free Update
3 Months Free Update
3 Months Free Update

TESTED 10 Jul 2026